
Dashboard
# Introduce the Dashboard
# What’s the Dashboard
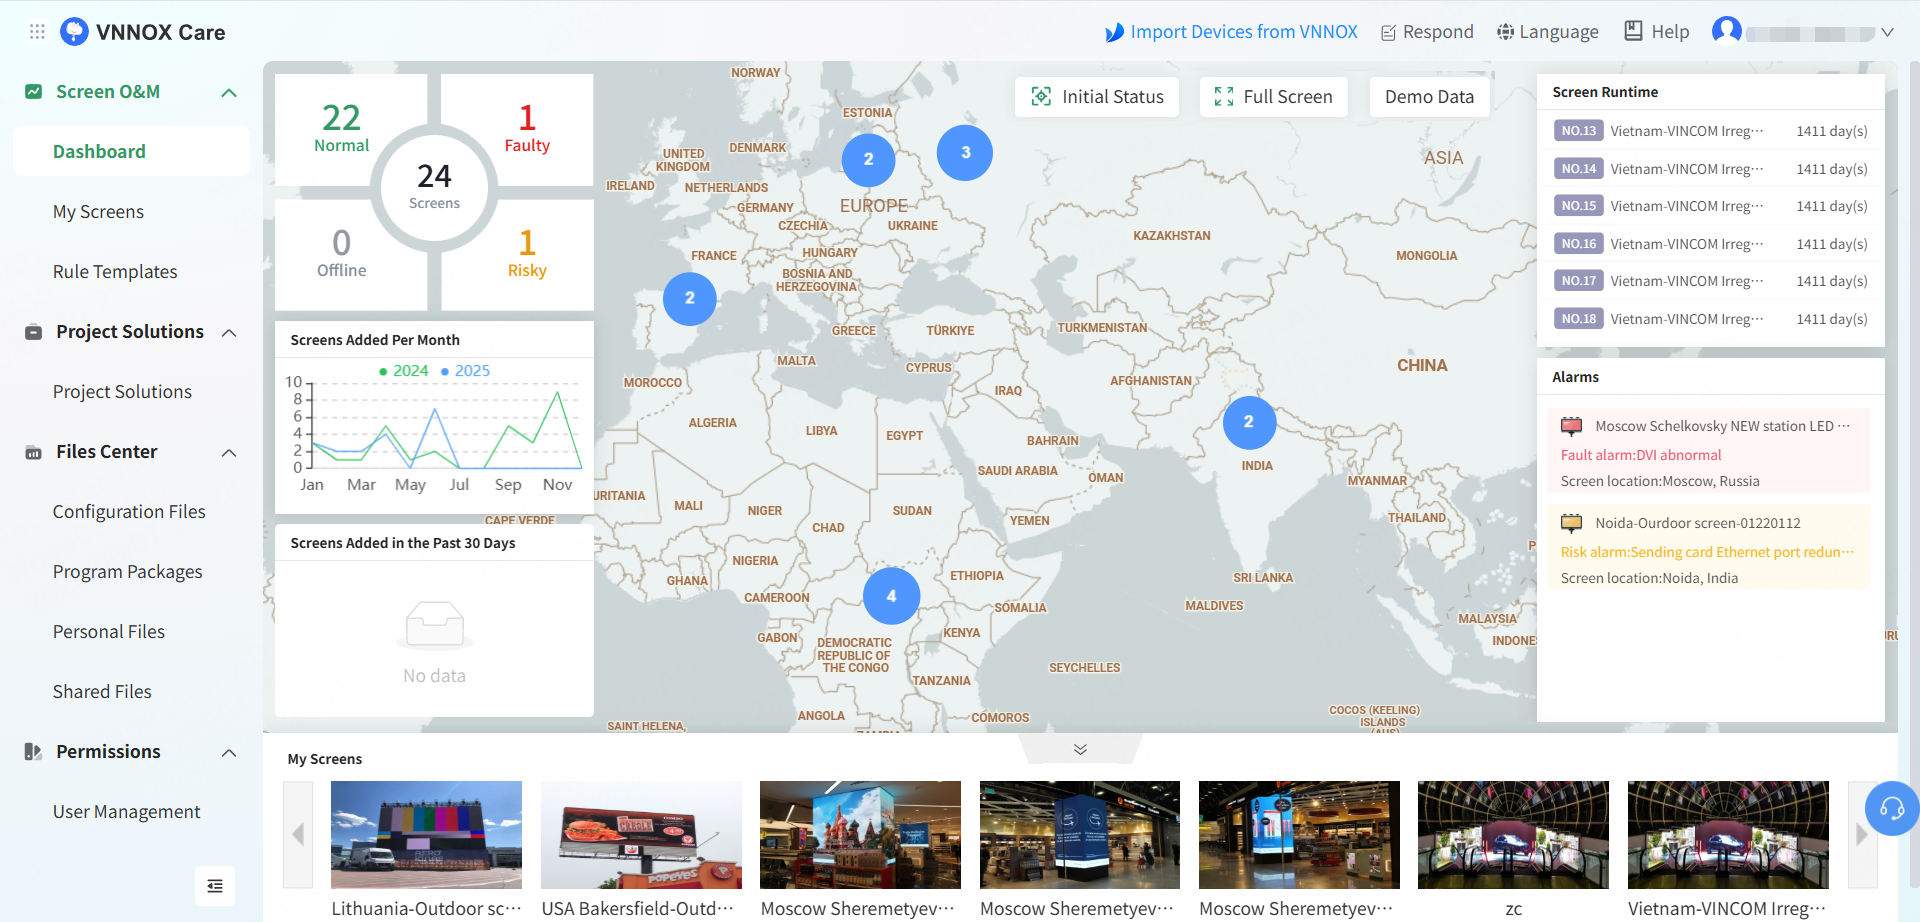
The dashboard presents the distribution and real-time operational status of screens, and the number of screens in each status on a map. The runtime, alarms, live snapshots and other basic information of screens are also displayed on the map. The dashboard is mainly used for showing the business sectors and operation data of enterprises in exhibition halls or directly to customers.
# Roles and Scenarios
# Sales Personnel
When sales personnel visit customers, the dashboard can be used to give a visual presentation of the enterprise size and project operations to promote sales.
# Managers
The dashboard can be used to show the marketing plan and operation management in exhibitions and conferences. In addition, managers can devise appropriate business strategies according to screen quantity, locations and operation information.
# Benefits
# Business Presentation
The dashboard can comprehensively display business sectors and enterprise strength to enhance enterprise image and amplify brand influence.
# Operation Data
When you deliver a work report or summary, you can use the dashboard to display the locations, quantities and statuses of screens, reducing data statistics and making business achievement presentation more efficient and intuitive.
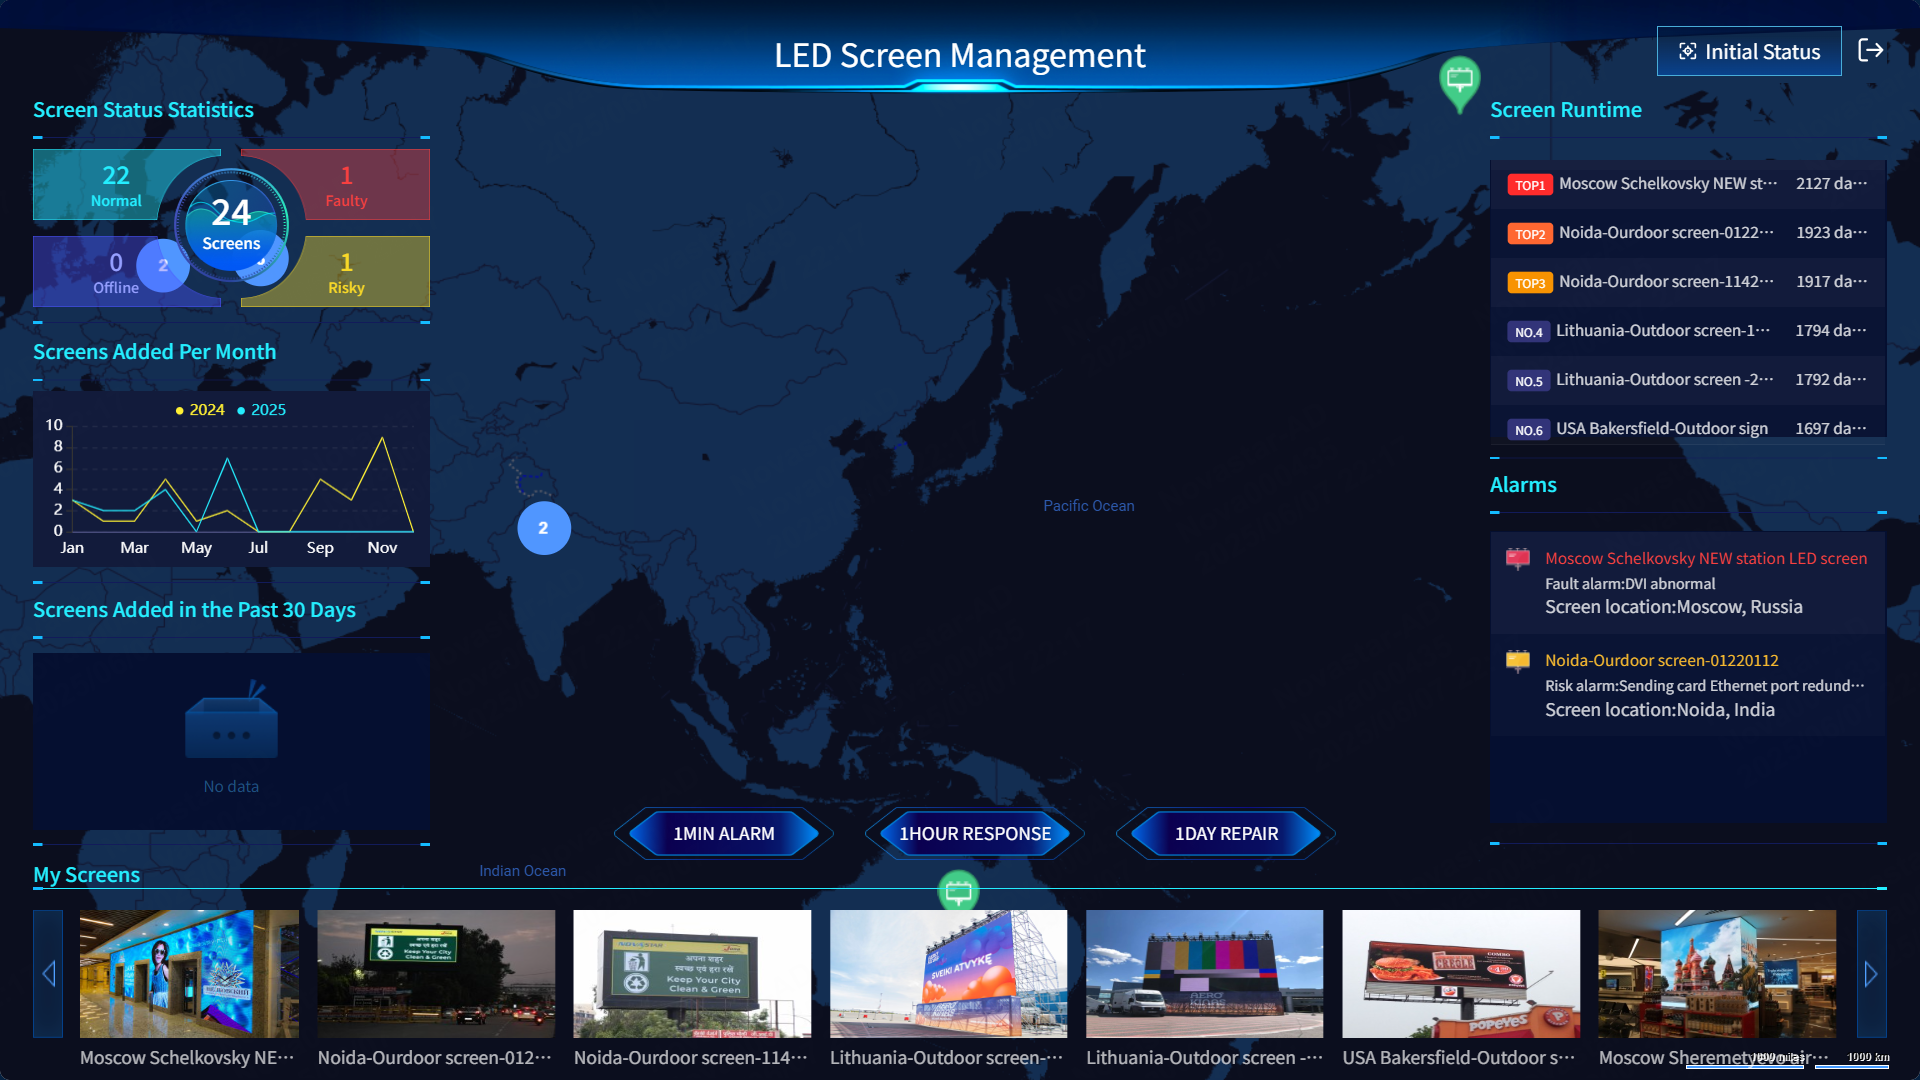
# Enable Full Screen View
On the homepage, click Full Screen to give an all-round presentation for customers in a full screen view.
Tips: In the full screen view, you can press the Esc button on your keyboard or click  at the top right to exit full screen.
# View the Dashboard
# Screen Operation Statuses
The number of screens in each status is displayed and the basic information on faulty and risky screens are listed, allowing for more efficient maintenance.
Screen statuses are illustrated in the table below.
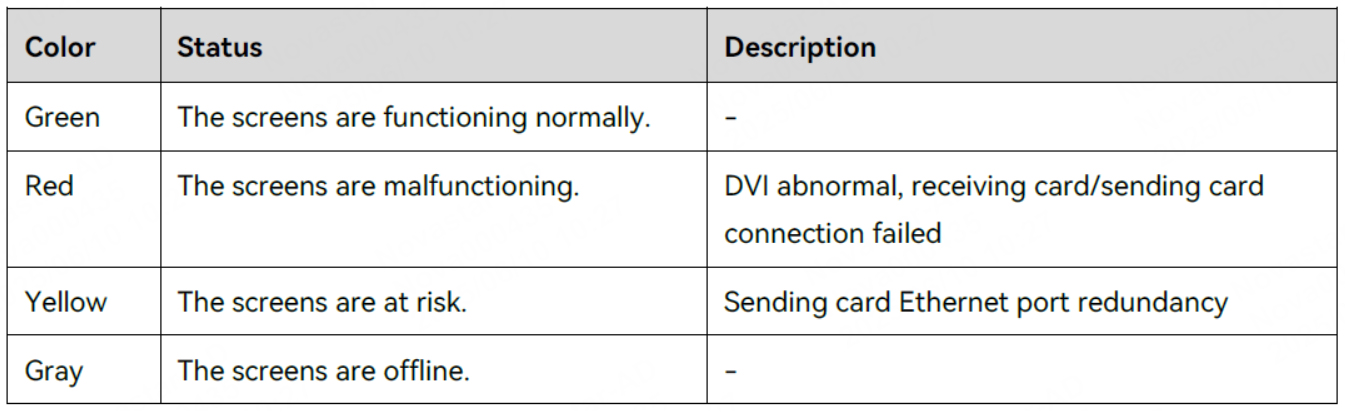
# Screen Locations
The locations of screens are shown precisely on the map, and different colors are used to illustrate the statuses of screens. The map displays the basic information, including screen name, status, brightness, and location.
# Screen Runtime
The runtime of each screen is displayed in the form of a scrolling list. The runtime of a screen is calculated from the time when it is bound to VNNOX Care.
# Screens Added Per Month
The number of screens bound each month is displayed in the form of a line chart.
# New Screens
The screens bound to VNNOX Care in the past month are listed.
# Alarms
When a screen fails, this section will display the cause of the failure and specify the precise location.
# Live Snapshots
If a camera is connected an d the camera configuration is completed, remote monitoring of a screen in real time can be enabled. If the camera is not configured, manually upload the snapshots taken by the camera.
# Configure Demo Mode
- At the upper right of the dashboard, choose Demo Data > Configure Demo Data to access the demo data configuration page.
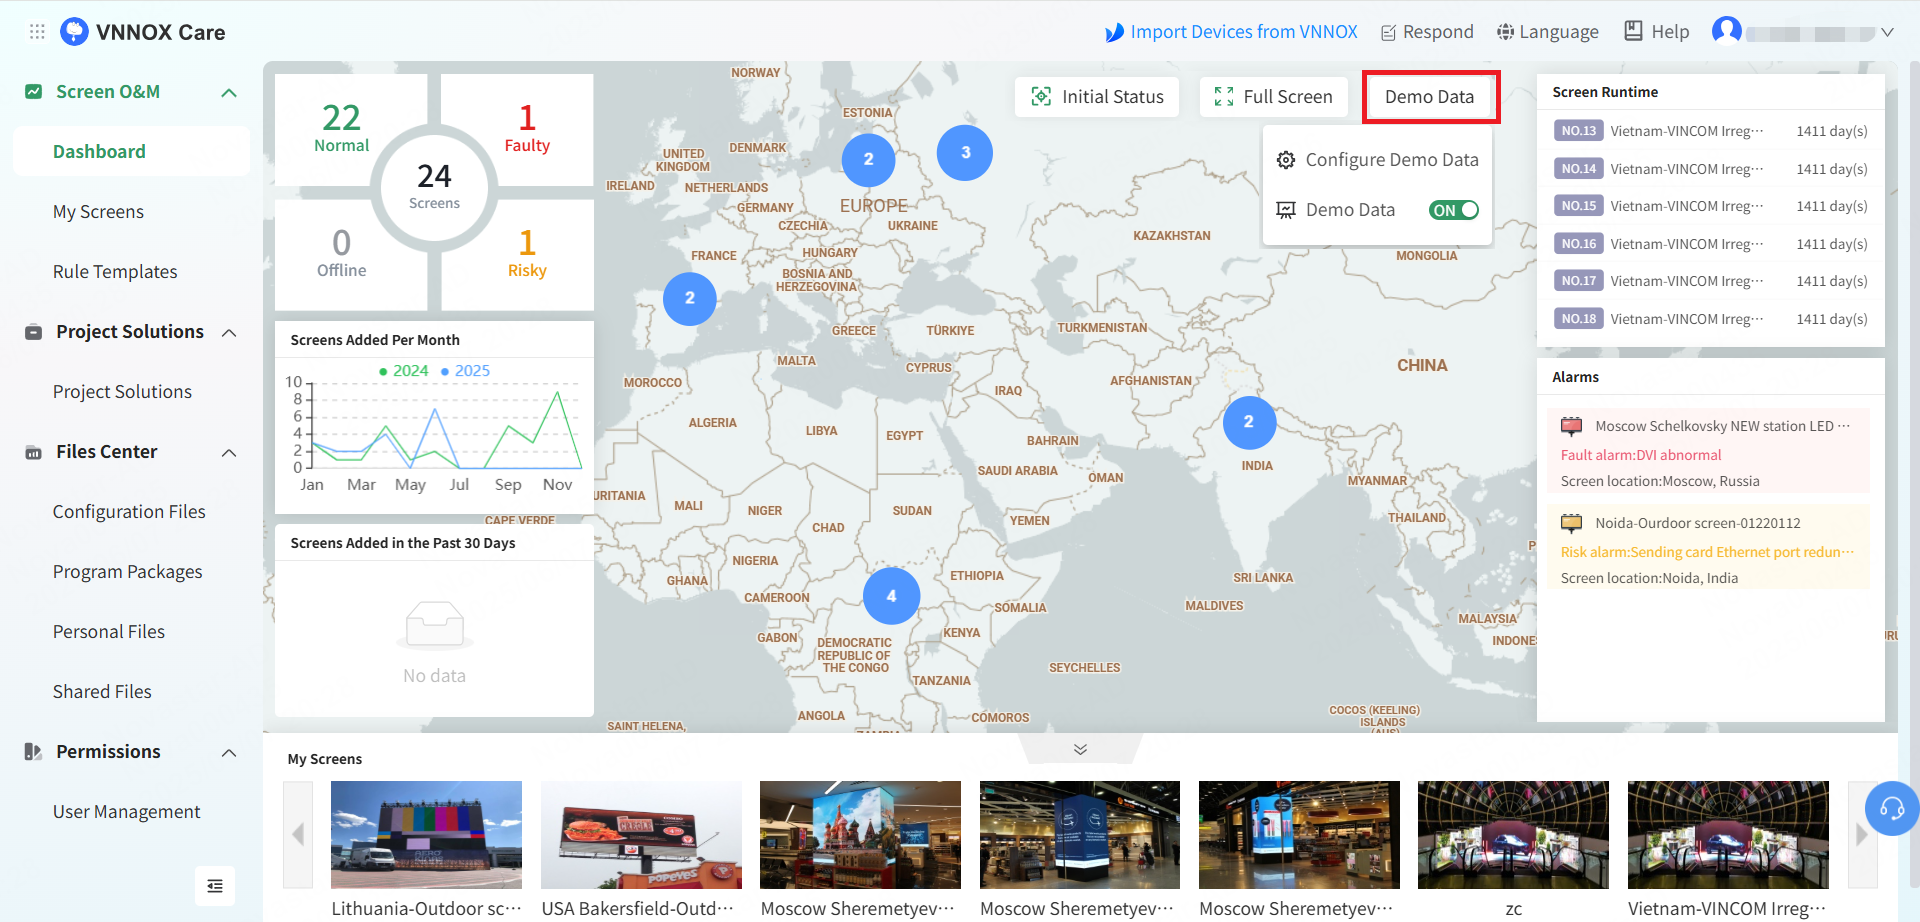
After demo data is enabled, all demonstration data will be displayed on the dashboard.
- Click New and configure the screen information as needed.
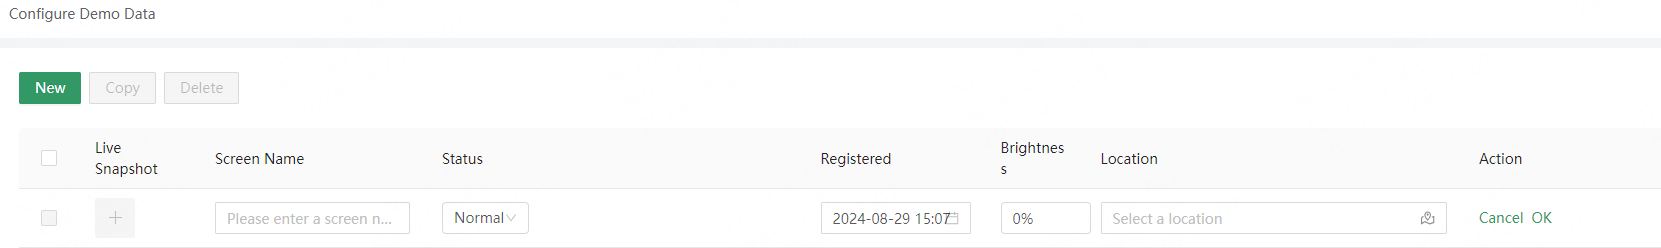
- Click OK to complete the configuration.