My Screens
# Manage Basic Screen Information
Users can choose Screen O&M > My Screens to view the total number of screens and the number of screens that are online, faulty, at risk, or offline, and do the following as needed.
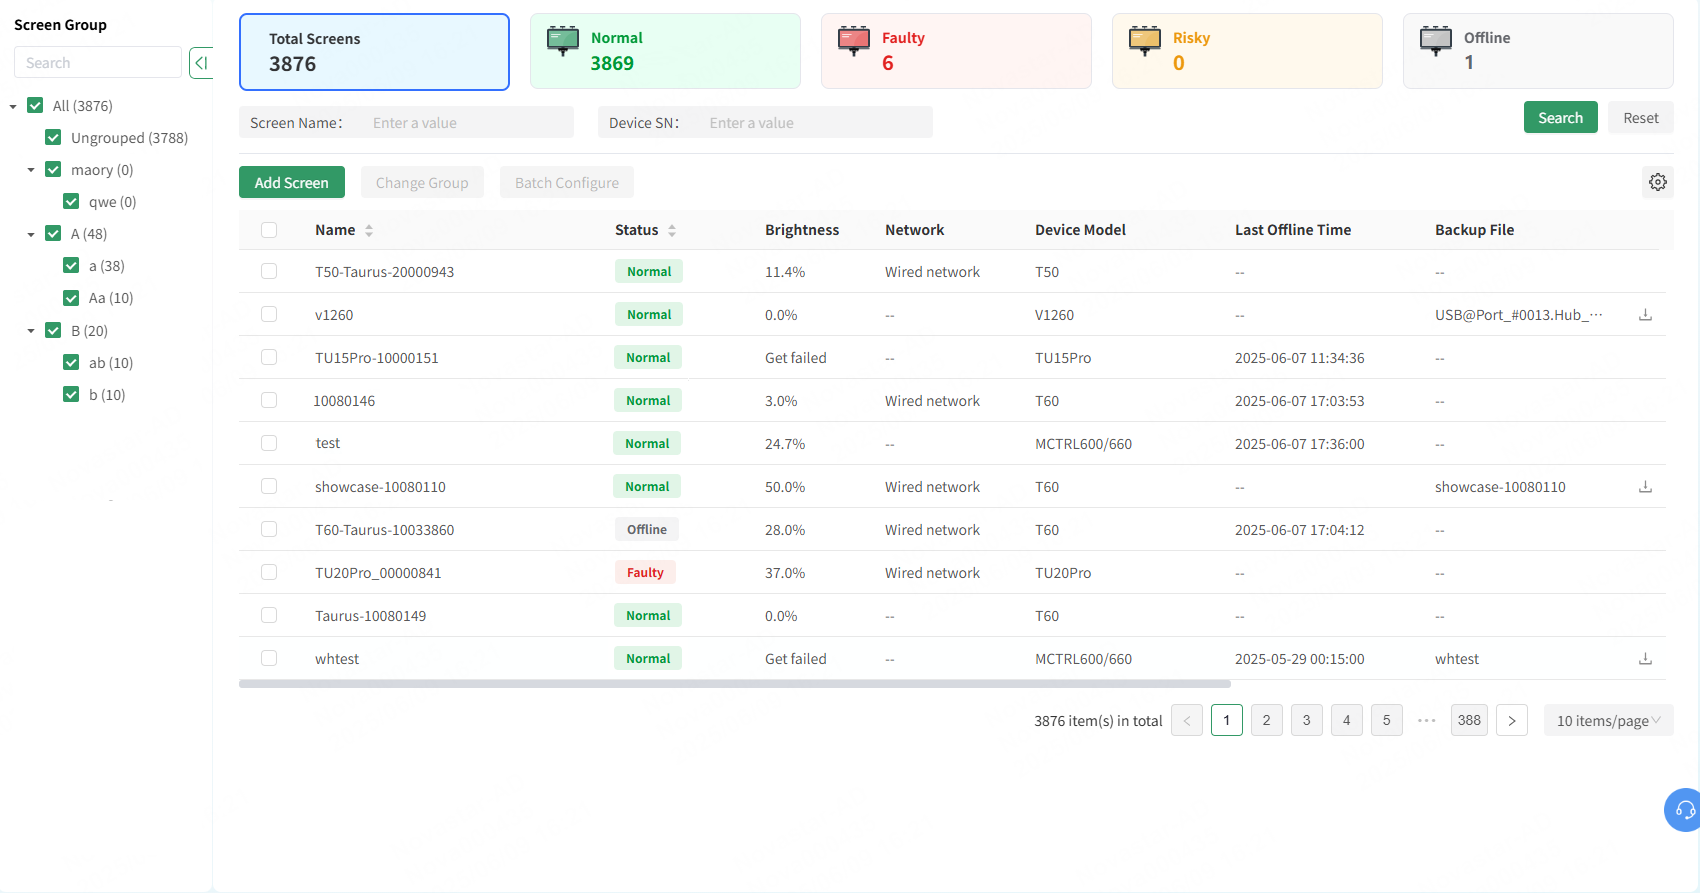
# Add Screens
Click Add Screen and choose Import from Local File or Import from VNNOX to import devices.
# Search/Filter Screens
Supports searching for screens by name or device SN, and can also filter screens by network type, screen type, and application scenarios.
# Manage Screens by Group
Users can create screen groups and change the groups of screens.
- Create a group: In the list of screen groups on the left, click
 next to a group name, enter a group name in the window that appears, and then click OK.
 - Change a group: Select a screen and click Change Group. In the window that appears, select a group and click OK.
- Rename/Delete a group: In the list of screen groups on the left, click
 next to a group name and select Rename or Delete to rename or delete the group.

# Batch Configure
Select multiple screens and click Batch Configure to configure the basic screen information, alarm notifications, alarm rules, and brightness templates.
# Import Devices by Using Local Files
VNNOX Care allows users to import devices by using local files.
Prerequisites:
The screen monitoring data is exported in NovaLCT.
- Choose My Screens > Add Screen > Import from Local File.
- In the window that appears, select a local file and click Open.
# Import Devices from VNNOX
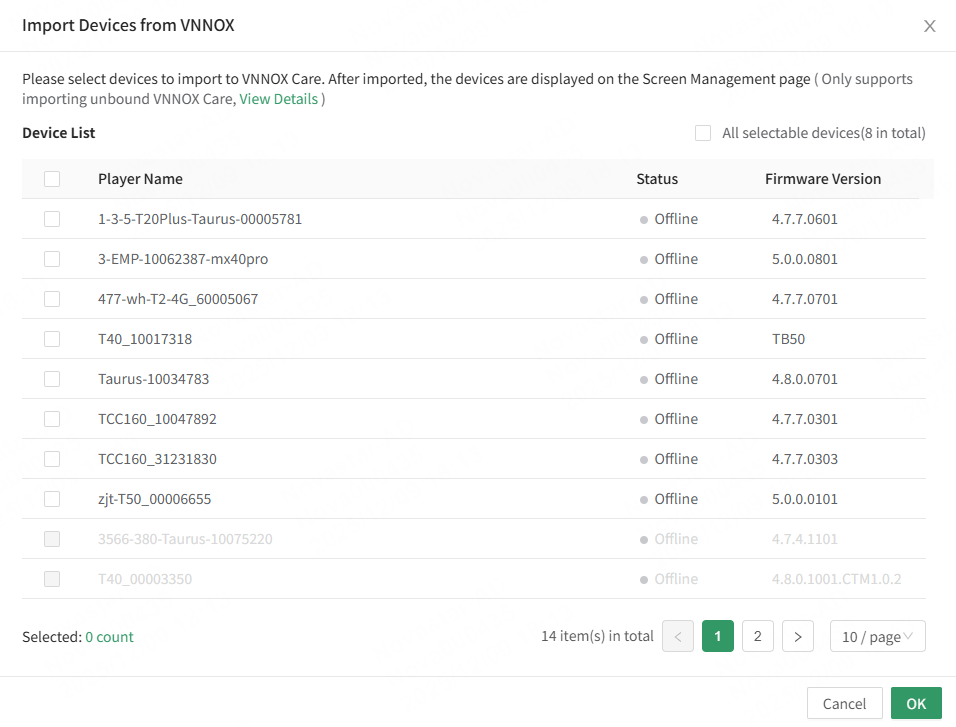
Devices can be directly imported from VNNOX to VNNOX Care. This allows a large number of fixed installation screens that use VNNOX for content publishing to be bound to VNNOX Care, enabling monitoring and maintenance through VNNOX Care without the need for re-binding. This seamless process provides a comprehensive service from publishing to monitoring and maintenance.
Prerequisites: The devices are not bound to other VNNOX Care accounts.
- On the homepage, click Import Devices from VNNOX at the top right or choose Screen O&M > My Screens > Add Screen > Import from VNNOX.
- In the window that appears, enter your VNNOX account and password and click OK to log in.
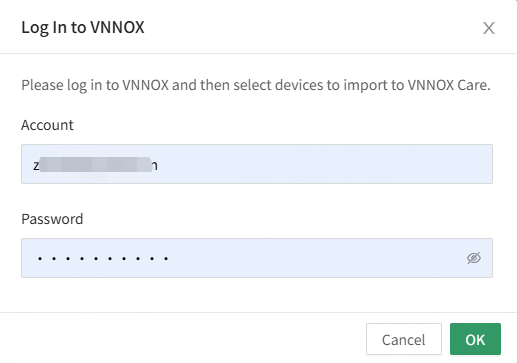
- Select the devices you want to import and click OK.
# Monitoring
The Monitoring tab page displays the status and other information of the current screen, receiving card, module and controller. You can also manage the screen and controller, including screen status, brightness adjustment, sending configuration files, recover the screen using backup files, upgrade the receiving card, sync time, restart and upgrade the controller, etc.
On the homepage, choose Screen O&M > My Screens and select the target screen. Perform the related operations on the Monitoring tab page.
# Supported Devices
Notes:
- The devices listed in the table only include the mainstream models (customized or discontinued models are not included).
- The alarm and monitoring data of synchronous devices is uploaded to VNNOX Care via NovaLCT. The alarm and monitoring data of asynchronous devices and the MBOX series can be directly uploaded to VNNOX Care without using NovaLCT.
| Type | Series | Supported Models |
|---|---|---|
| Synchronous Devices | MCTRL series+ other sending cards | MCTRL300 / MCTRL500 / MCTRL600 / MCTRL660 PRO / MCTRL660 ROE / MCTRL4K / MCTRL4K-S / MCTRL4K_ViewPro / MCTRL700 / MCTRL700 Pro / MCTRL R5 / MP8-JF / ASD200 / E500 / E510 / MSD700 / MSD700_1 / LP10SD1600 / SD2000E / GT4000 / FTSC4000-E |
| KT series | KT3 / KT16_ZM / KT16E / KT8E / KT20L / KT16C | |
| All-in-one series | -VC series: VC2 / VC4 / VC6 / VC6 Pro / VC10 / VC10 Pro / VC16 -VX: series: VX1 / VX400 / VX400s / VX400s-N / VX400 Pro / VX600 / VX600 Pro / VX1000 / VX1000 Pro / VX2000 Pro / VX16s | |
| Asynchronous Devices | Taurus series | T1-4G / TB1-4G / TB2-4G / TB10 Plus / TB20 Plus / TB30 / TB40 / TB50 / TB60 / TCC70 / TCC160 |
| TU series | TU15 Pro / TU20 Pro / SMP6 Pro / SMP4 Pro / TU4K Pro | |
| Other Devices | MBOX series | MBOX600 / MBOX600 Pro |
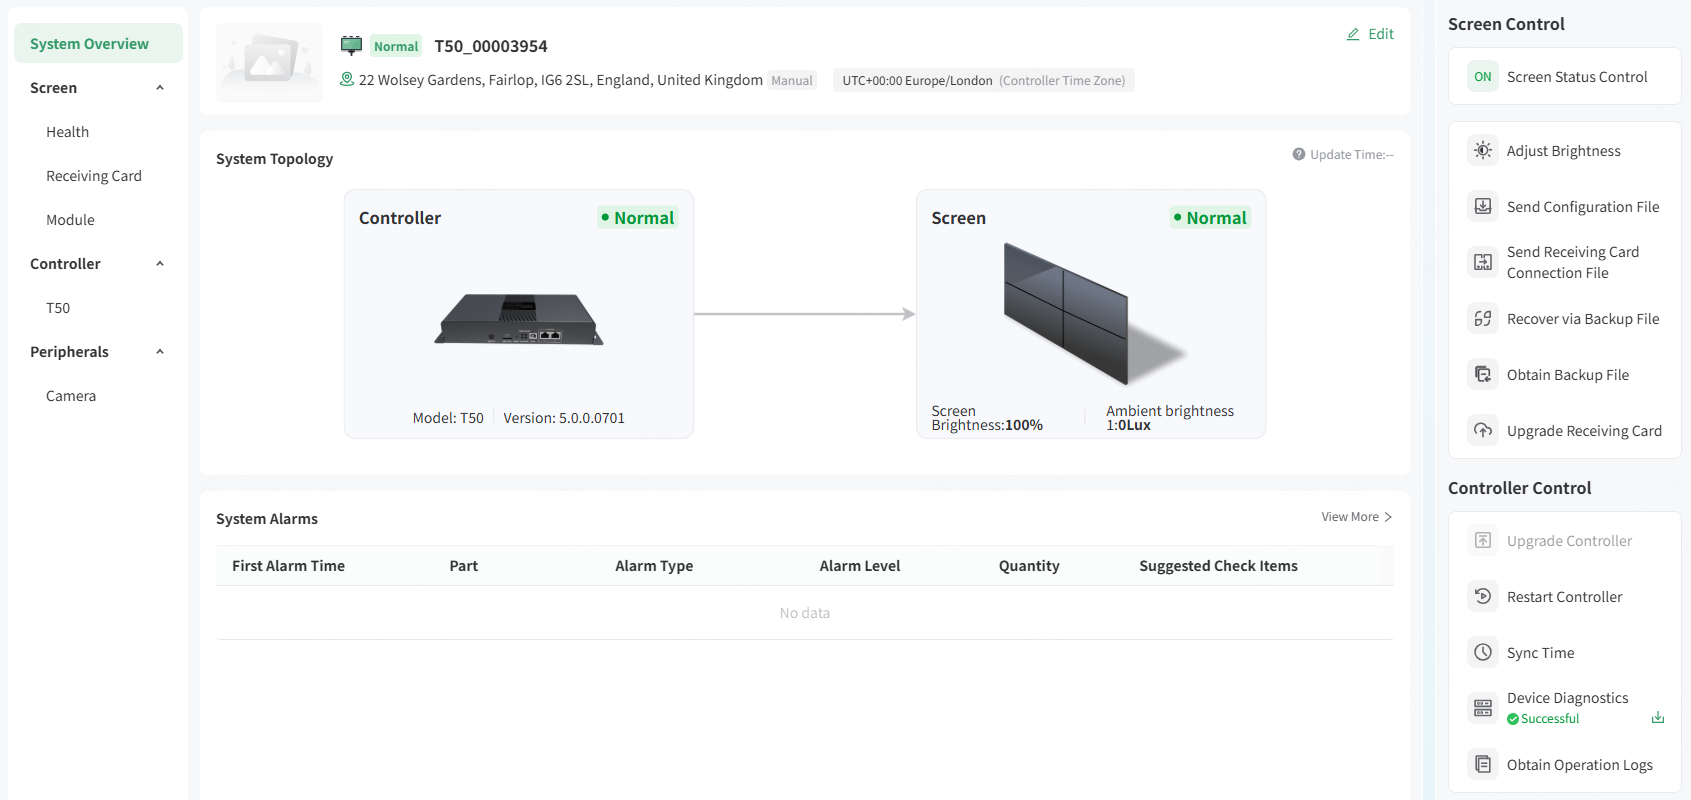
# System Overview
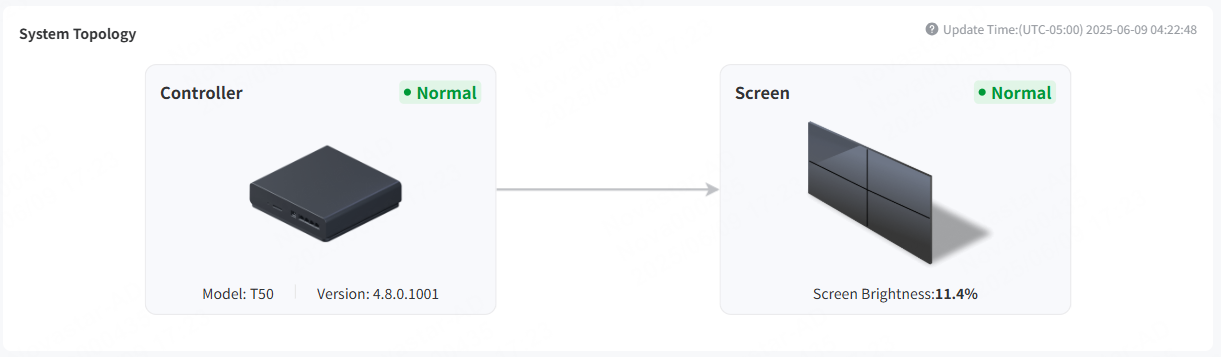
The System Overview tab page displays the screen information, live snapshot, system topology, system alarms, and other information.
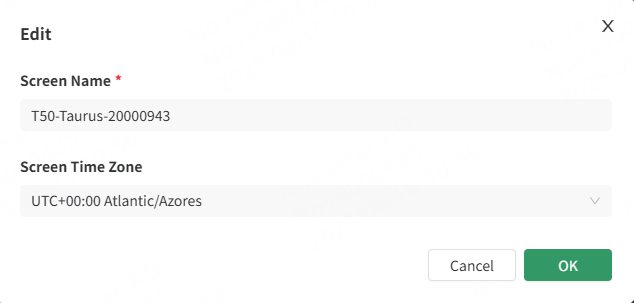
# Edit Screen Information
Click the screen name to be edited or click Details in the Action column. Select the Monitoring tab and select System Overview on the left to edit or view the scree information.
- Edit information: Click a screen name and click Edit on the Monitoring tab page to edit the screen name and time zone.

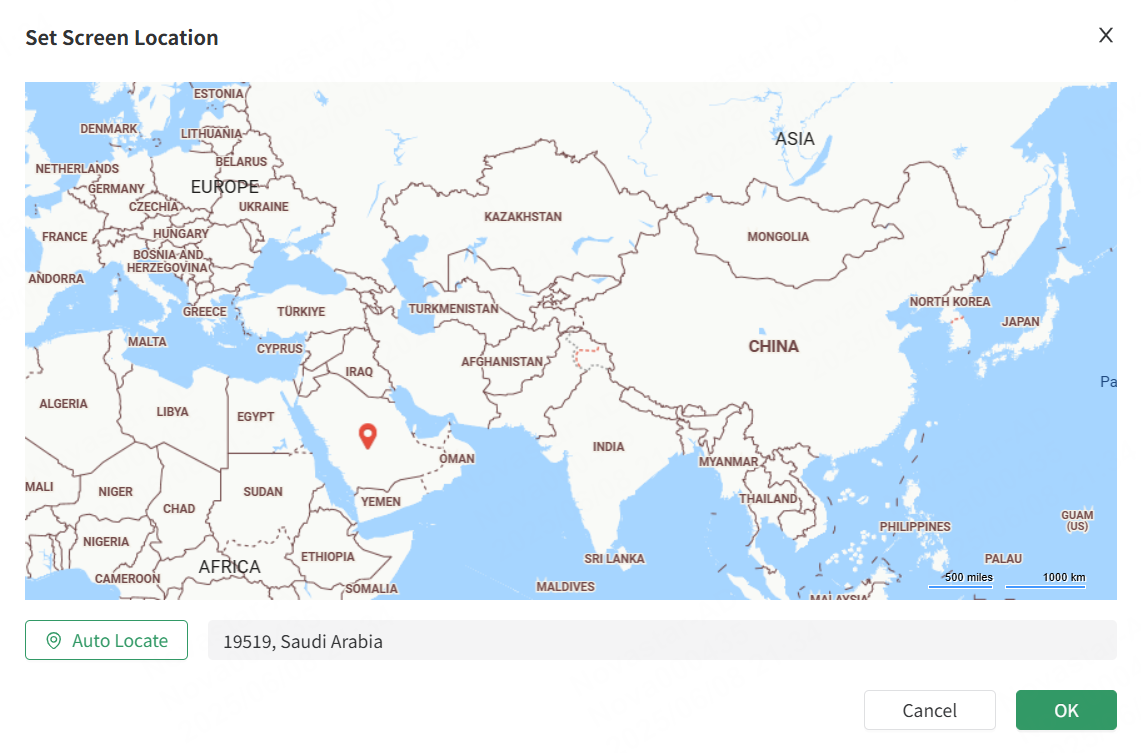
- Set screen location: Click the screen location or
 to set the screen location in the window that appears. After the settings are complete, click OK.
- View the live snapshot: If no camera is connected, hover your mouse over the image and click
 to upload an on-site snapshot captured while installing the screen VNNOX Care so that the user can quickly learn about the screen installation during maintenance. Click
  to view the enlarged image.
# View System Topology
The System Topology section displays the topology between the screen and device.
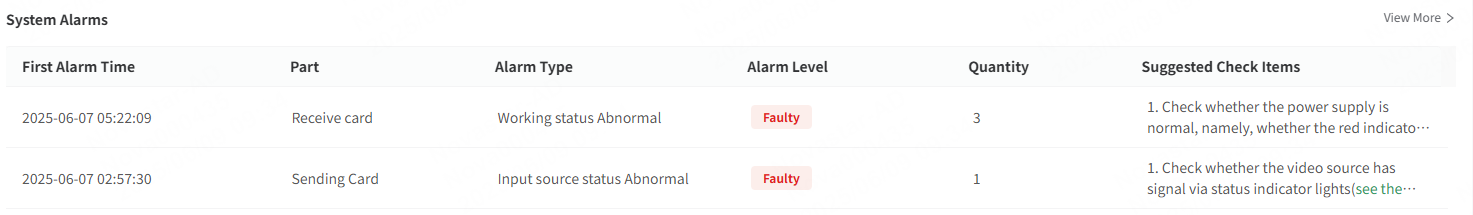
# View System Alarms
The System Alarms section displays all the alarm information of the screen. Click View More to redirect to the Alarm History tab page to view more alarm information.
# Screen Monitoring Details
# Health
On the left of the Monitoring tab page, choose Screen > Health to display the current connection layout of the receiving cards and modules. The status indicators (green: normal, yellow: risky, red: faulty) for anomalies on the receiving cards and modules are displayed in the diagram. Monitoring the real-time status of the screen and device aids users in swiftly and accurately locating potential issues, enabling them to promptly take appropriate measures for resolution.
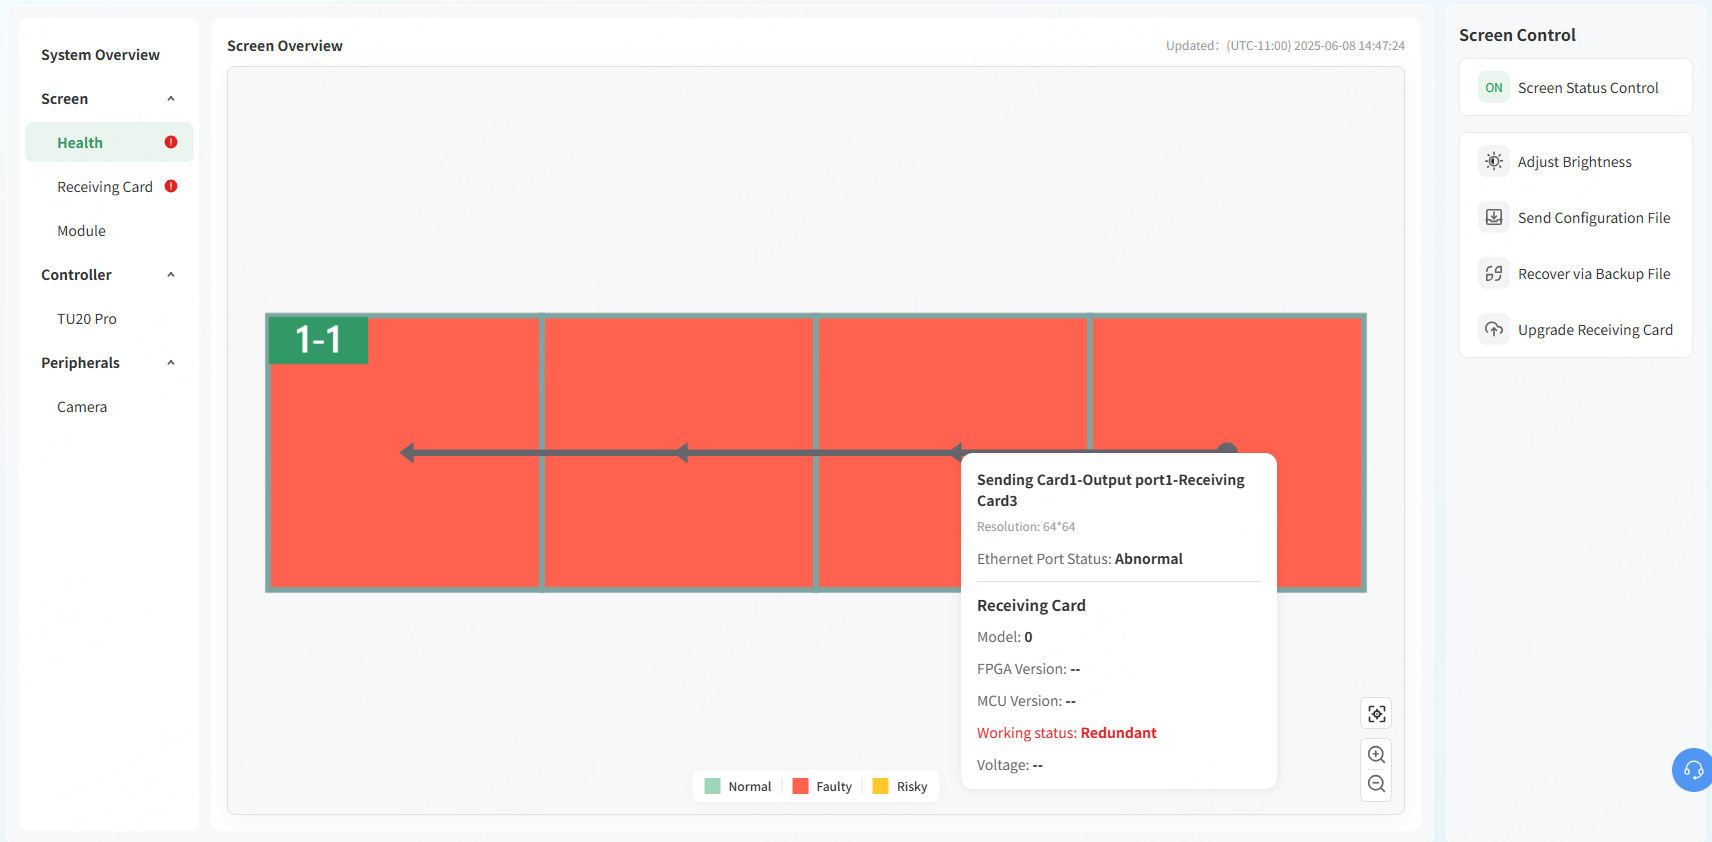
When you hover the mouse over the receiving card, information such as the receiving card's location, resolution, Ethernet port status of the sending card, receiving card model, version (FPGA, MCU), operating status, voltage, and temperature can be displayed.
# Receiving Card Details
- Choose Screen > Receiving Card to display the connection layout of the receiving cards.
- Select the Working Status, Temperature or Voltage tab to view details.
- Working Status: Displays the working statuses of the receiving cards.
- If the working status of a receiving card is abnormal, the abnormal status (green: normal, yellow: risky, red: faulty, gray: unknown) will be displayed on the diagram.
- Hovering the mouse over the receiving card displays its location, model, version (FPGA, MCU), and working status.
- Temperature: Displays the temperatures of the receiving cards.
Hovering the mouse over the receiving card displays its location, model, version (FPGA, MCU), and temperature.
- Voltage: Displays the voltages of the receiving cards.
- If any voltage anomalies are detected, the abnormal status (green: normal, yellow: risky, red: faulty, gray: unknown) will be displayed on the diagram.
- Hovering the mouse over the receiving card displays the location, model, version (FPGA, MCU), and voltage.
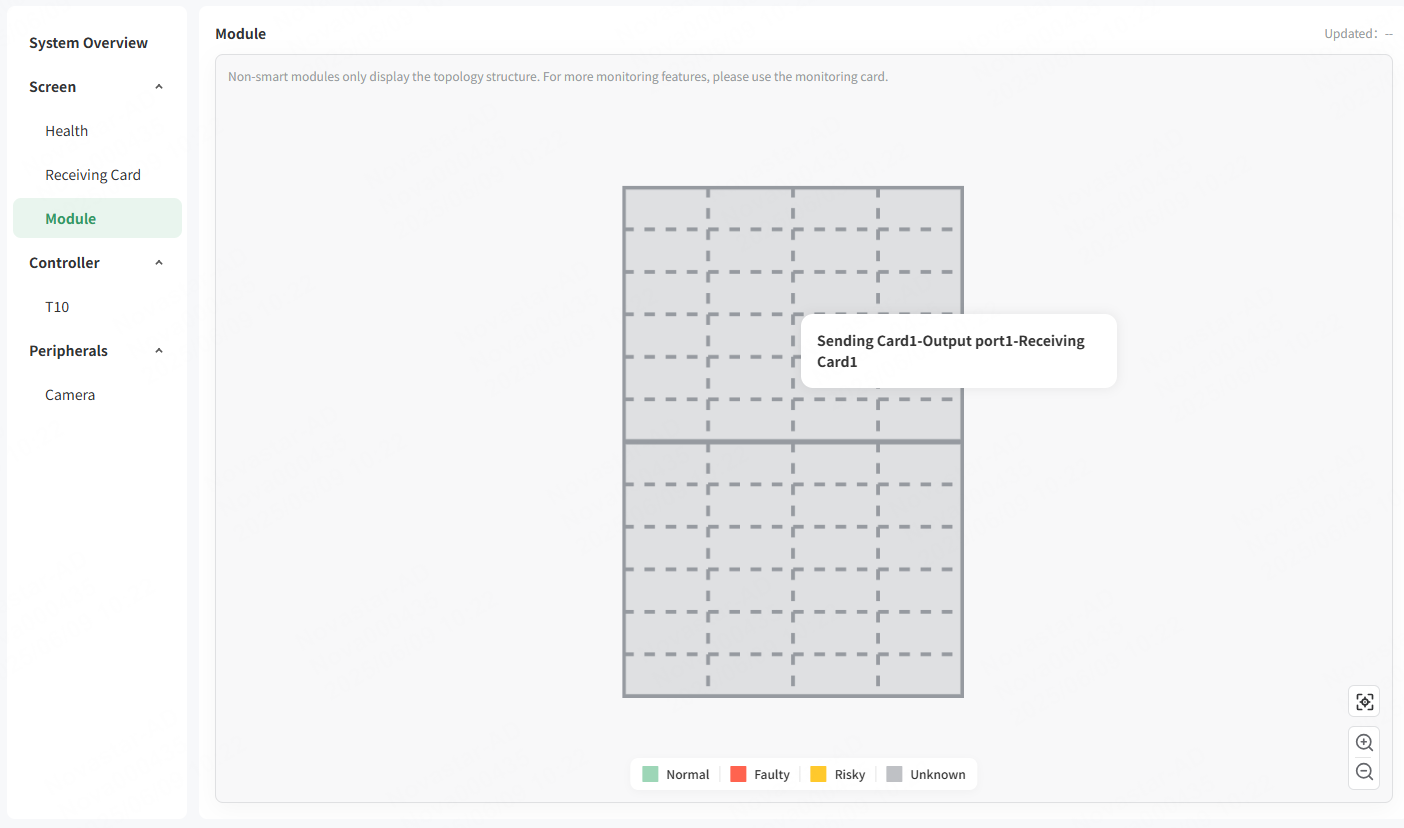
# Module Details
Choose Screen > Module to display the detailed information of the modules.
# Smart Module Details
- Choose Screen > Smart Module to display the connection layout of the smart modules.
- Select the Working Status, Flat Cable, Temperature, Voltage, or Faulty LEDs tab to display the corresponding details.
- Working Status: Displays the working statuses of the smart modules.
- If the working status of a smart module is abnormal, the abnormal status (green: normal, yellow: risky, red: faulty, gray: unknown) will be displayed on the diagram.
- Hovering the mouse over a smart module displays its location, sequence number, the number of scans, driver IC, decoder IC, and working status.
- Flat Cable: Displays the flat cable connection of the smart modules.
- If a flat cable is abnormal, the abnormal status (green: normal, yellow: risky, red: faulty, gray: unknown) will be displayed on the diagram.
- Hovering the mouse over a smart module displays its location, sequence number, the number of scans, driver IC, decoder IC, and working status.
- Temperature: Display the thermal distribution of the smart modules.
Hovering the mouse over a smart module displays its location, sequence number, the number of scans, driver IC, decoder IC, and temperature.
- Voltage: Displays the voltages of the smart modules.
- If the voltage of a smart module is abnormal, the abnormal status (green: normal, yellow: risky, red: faulty, gray: unknown) will be displayed on the diagram.
- Hovering the mouse over a smart module displays its location, sequence number, the number of scans, driver IC, decoder IC, and voltage.
- Faulty LEDs: Displays the faulty LEDs on the smart modules.
- If a screen has faulty LEDs that exceeds the specified alarm threshold, the alarm status (green: normal, yellow: risky, red: faulty, gray: unknown) will be displayed on the diagram.
- Hovering the mouse over a smart module displays its location, sequence number, the number of scans, driver IC, decoder IC, and the number of faulty LEDs (R, G, B, and virtual red).
Click Associate Detection Rule, select a rule from the window that appears, and click Save.
# Monitoring Card Details
- Choose Screen > Monitoring Card.
- Select the Working Status, Voltage, Smoke, Cabinet Door, Fan, or Flat Cable to display the corresponding details.
- Working Status: Displays the working statuses of the receiving cards.
- If the working status of a receiving card is abnormal, the abnormal status (green: normal, yellow: risky, red: faulty) will be displayed on the diagram.
- Hovering the mouse over the receiving card displays its location, model and working status.
- Voltage: Displays the voltages of the receiving cards.
- If the voltage of a receiving card is abnormal, the abnormal status (green: normal, yellow: risky, red: faulty, gray: unknown) will be displayed on the diagram.
- Hovering the mouse over the receiving card displays the location, model and voltage.
- Smoke: Displays the smoke status.
- If the smoke of a receiving card is abnormal, the abnormal status (green: normal, yellow: risky, red: faulty, gray: unknown) will be displayed on the diagram.
- Hovering the mouse over the receiving card displays the location, model and smoke status.
- Cabinet Door: Displays the statuses of the cabinet doors.
- If a cabinet door is abnormal, the abnormal status (green: normal, yellow: risky, red: faulty, gray: unknown) will be displayed on the diagram.
- Hovering the mouse over the receiving card displays the location, model and cabinet door status.
- Fan: Displays the working statuses of the fans.
- If a fan is abnormal, the abnormal status (green: normal, yellow: risky, red: faulty, gray: unknown) will be displayed on the diagram.
- Hovering the mouse over the receiving card displays the location, model and fan speed.
- Flat Cable: Displays the statuses of the flat cables.
- If a flat cable is abnormal, the abnormal status (green: normal, yellow: risky, red: faulty, gray: unknown) will be displayed on the diagram.
- Hovering the mouse over the receiving card displays the location, model and flat cable status.
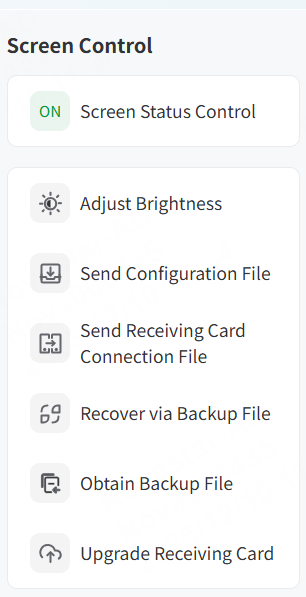
# Screen Control
In the Screen Control section on the right of the Monitoring tab page, users can control screen status, adjust brightness, send configuration files, send receiving card configuration files , recover the screen via backup file, obtain backup files , and upgrade receiving cards, allowing for centralized management of screens.
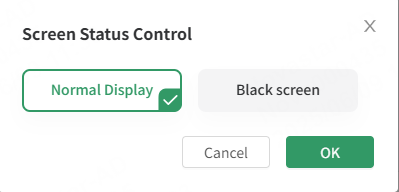
# Control Screen Status
Click Screen Status Control. From the window that appears, select Normal Display or** Black screen** and click OK.
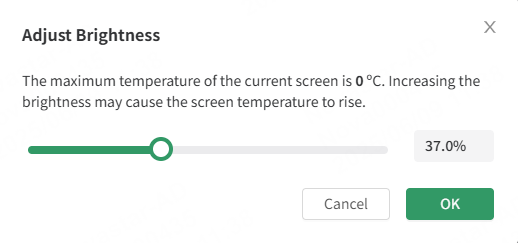
# Adjust Brightness
Click Adjust Brightness. From the window that appears, drag the slider to adjust the brightness and click OK.
# Send Configuration File
- Click Send Configuration File.
- From the window that appears, select a file from Backup Files, Personal Files, Configuration Files, or Shared Files.
Select receiving cards to send the selected configuration file.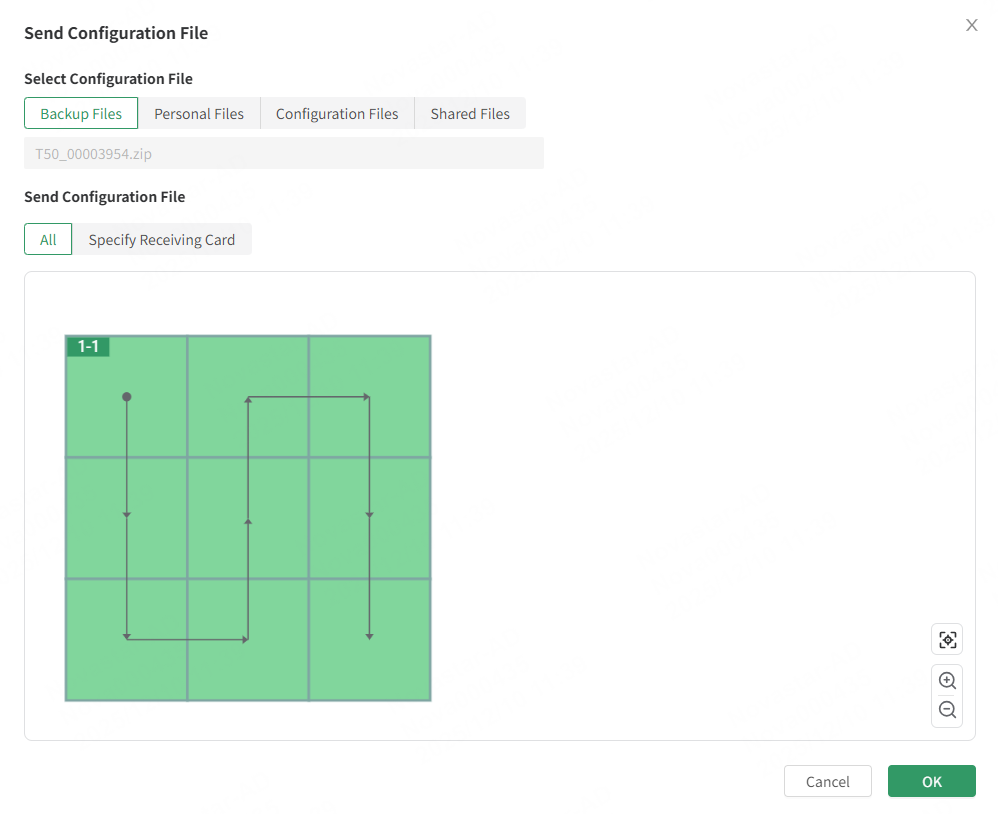
- Click OK and wait until the file is successfully sent.
# Send Receiving Card Connection File
- Click Send Receiving Card Connection File.
- From the window that appears, select a file from Backup Files, Personal Files, or Configuration Files.
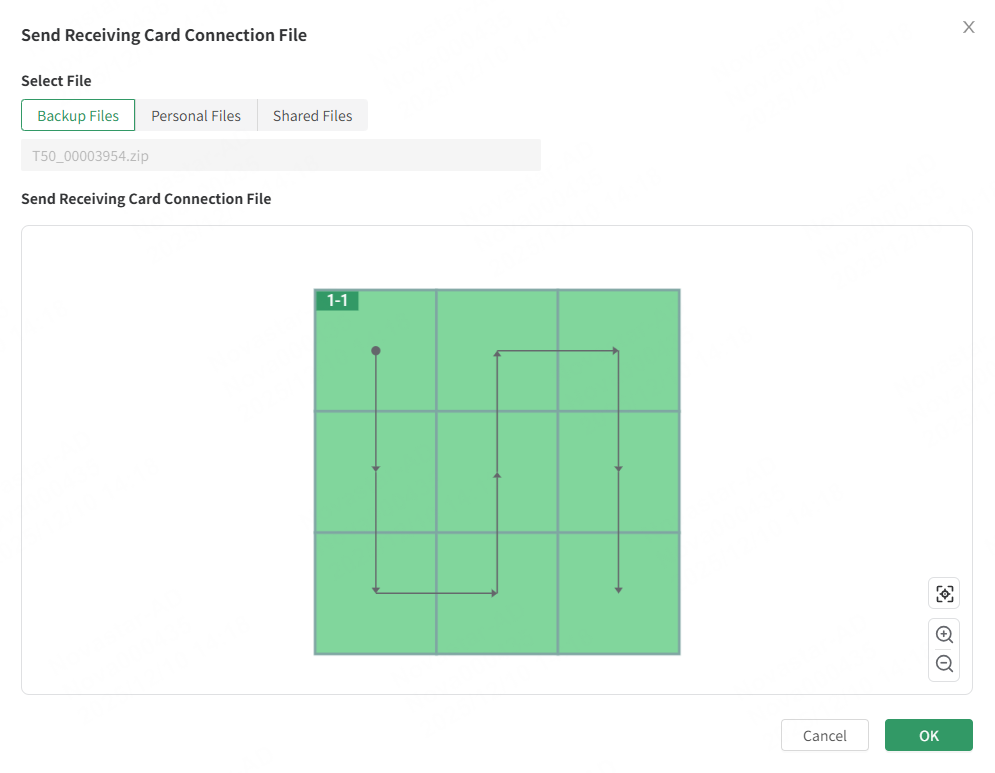
- Click OK and wait until the file is successfully sent.
# Recover Screen via Backup File
Prerequisites:
- The faulty screen has been bound to VNNOX Care by backing up its configuration file.
- VNNOX Care for web can recover screens of the asynchronous system only.
- If a hardware device is damaged, it cannot be recovered remotely and needs to be replaced on site.
- Click Recover via Backup File.
- In the dialog box that appears, click OK to restore the screen parameters.
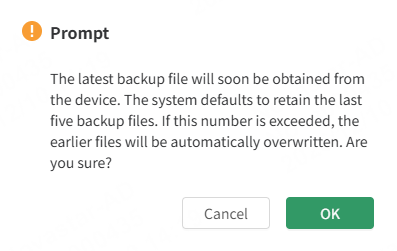
# Obtain Backup File
- Click Obtain Backup File.
- In the dialog box that appears, click OK to obtain the latest backup file of the device.
# Upgrade Receiving Card
- Click Upgrade Receiving Card.
- From the window that appears, select an upgrade package from Personal Files, Receiving Card Program Packages, or Shared Files.
- Select receiving cards to upgrade. You can select all the receiving cards or specify receiving cards.
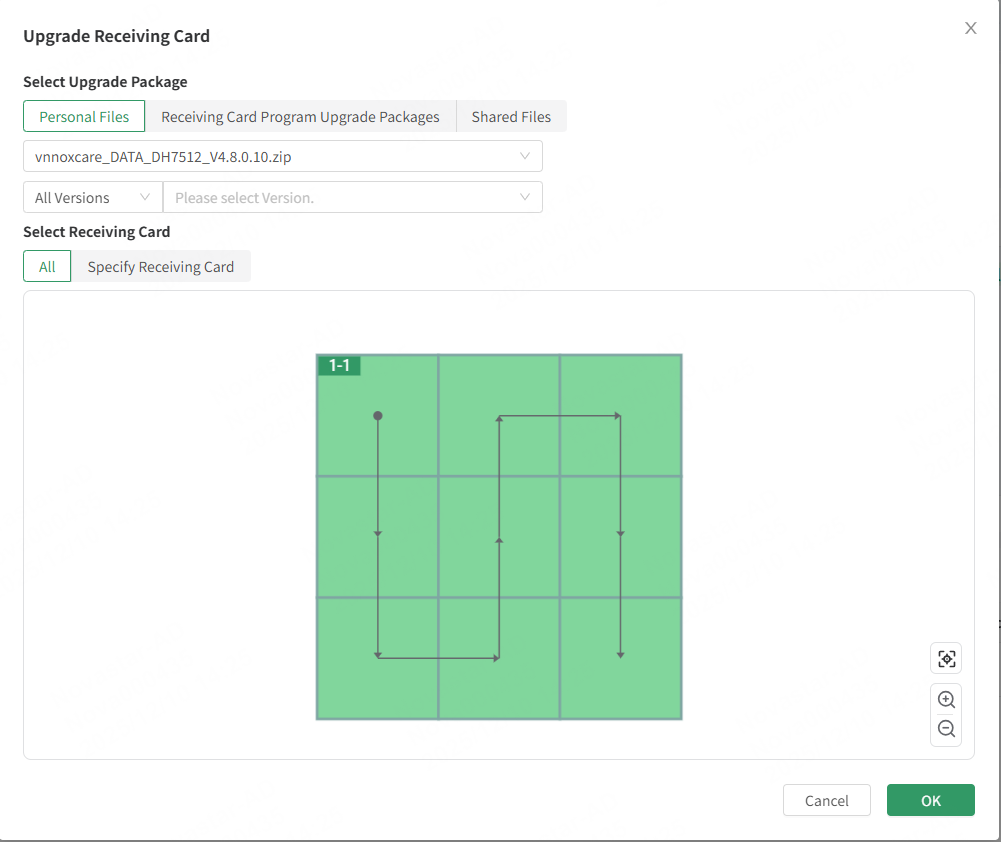
Note: If the screen contains multiple types of receiving cards, select Specify Receiving Card.
- Click OK and wait until the receiving cards are upgraded successfully.
# Controller Monitoring Details
On the left of the Monitoring tab page, choose Controller and select a controller to display its connector information, basic information, and operation information. The information displayed may vary according to the capabilities of different devices. Additionally, you can upgrade the controller, restart the controller, obtain operation logs, configure time synchronization, and run diagnostics in the Controller Control section on the right side of the Monitoring tab page. 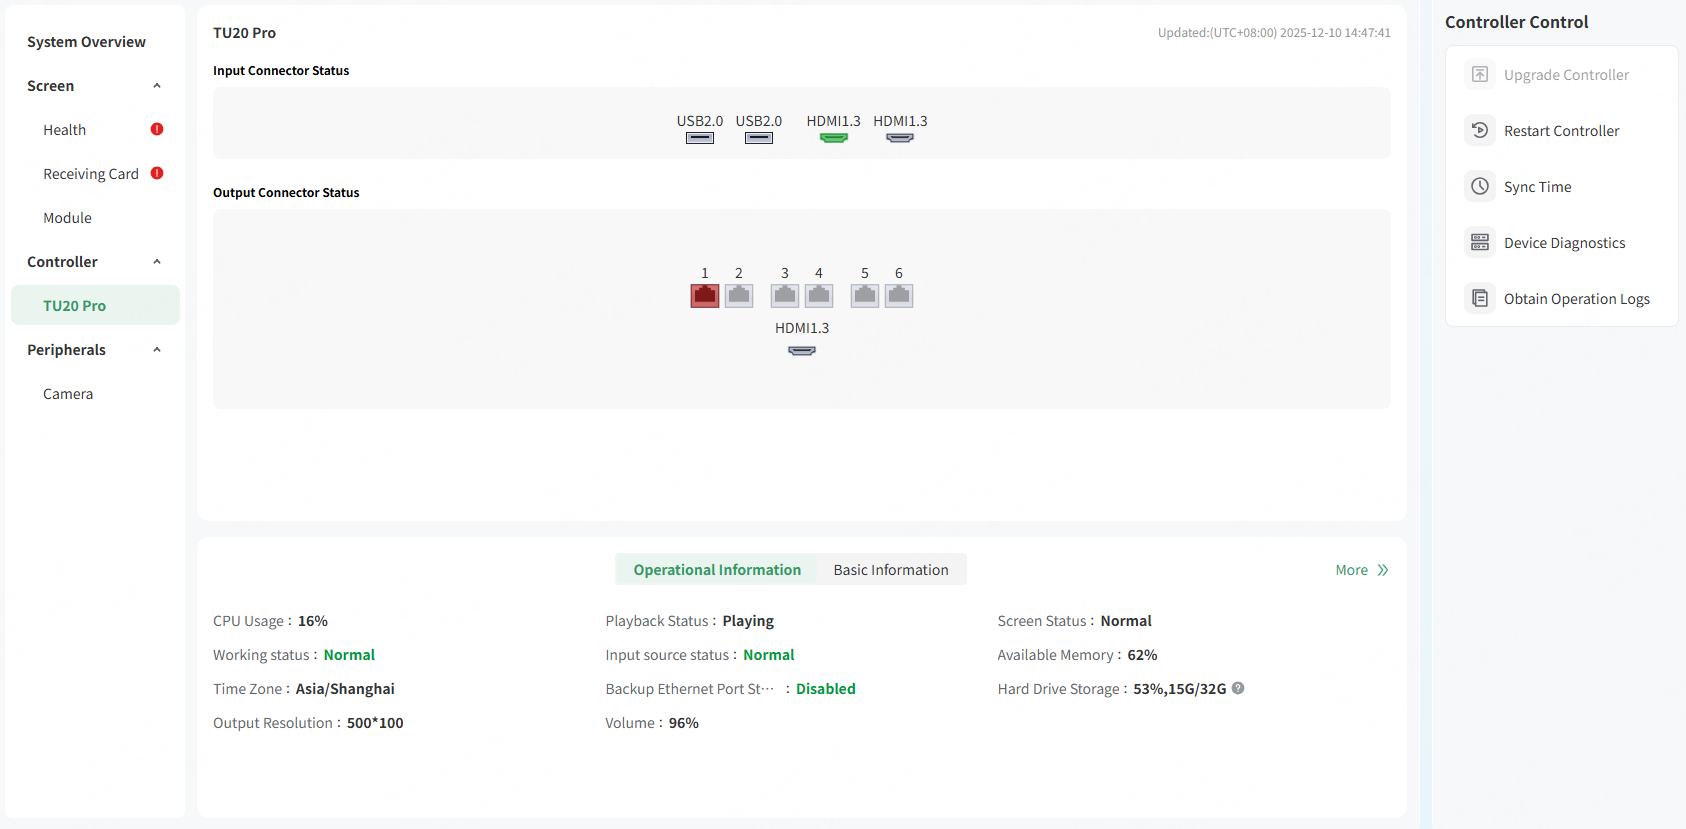
# View Controller Information
- Connector: The current connector status can be displayed according to the capabilities of different controllers.
 : Connected and functioning normally
 : Abnormal
 : Not in use
 : Backup connector, not in use, and not connected
 : Backup connector and not in use
 : Backup connector and in use
 : Backup connector abnormal
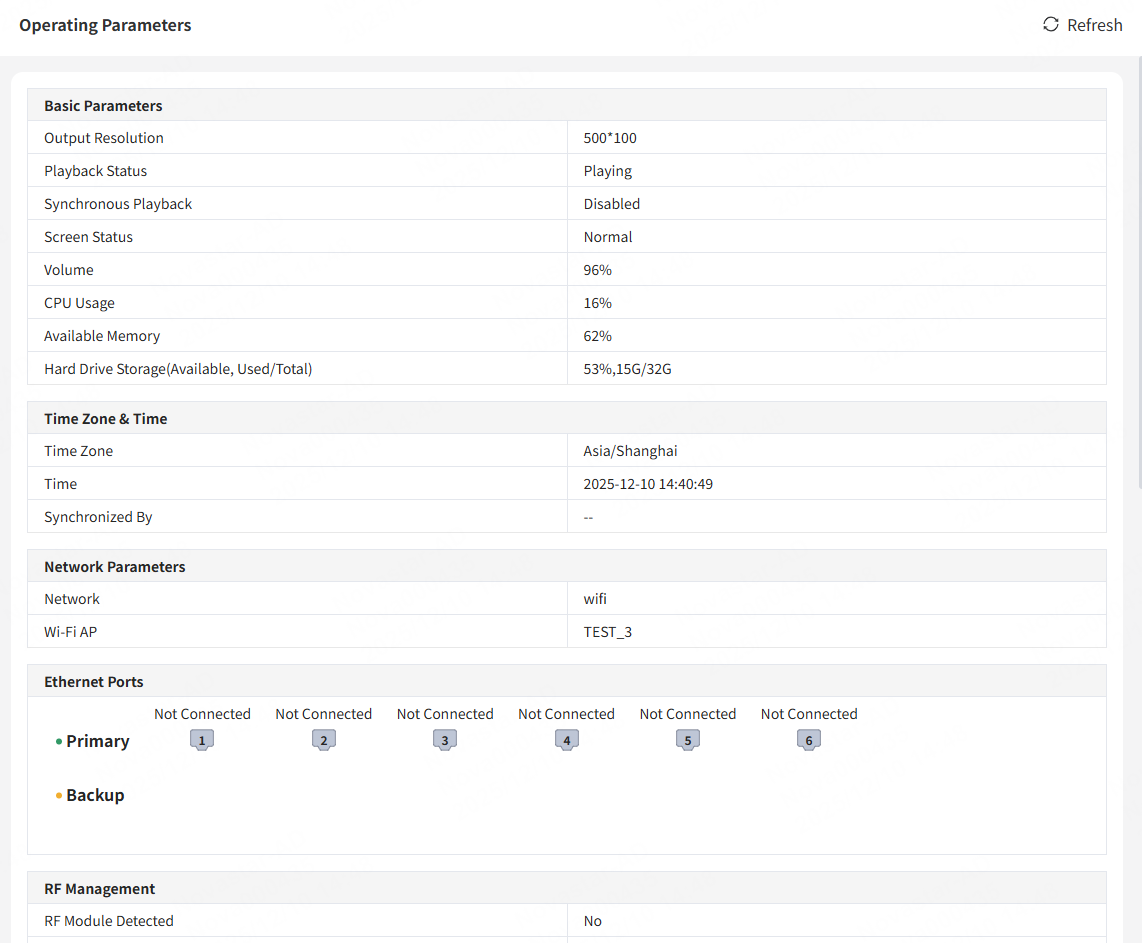
- Operational Information: Displays the controller’s operational parameters, including CPU usage, playback status, screen control status, operating status, input source status, available memory, hard drive storage, backup Ethernet port status, time zone, output resolution, volume, and more.
- Basic Information: Displays the controller’s basic parameters, such as model, SN, software version, network type, MAC address, and number of Ethernet ports.
To view more detailed parameters, click More.
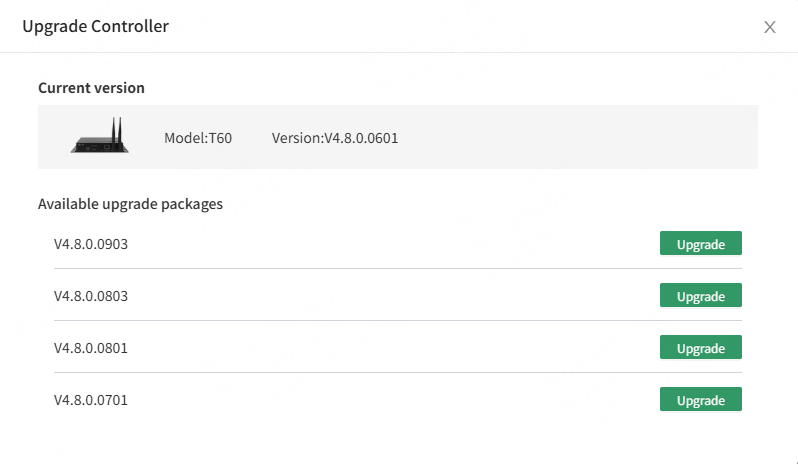
# Upgrade Controller
Click Upgrade Controller. In the window that appears, view the current device version and available upgrades and click Upgrade next to the desired version. In the dialog box that appears, click OK and wait until the device is upgraded successfully.
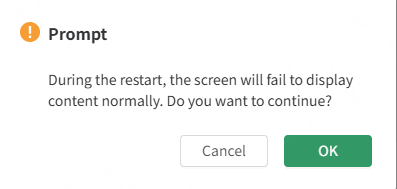
# Restart Controller
Click Restart Controller and click OK in the dialog box that appears.
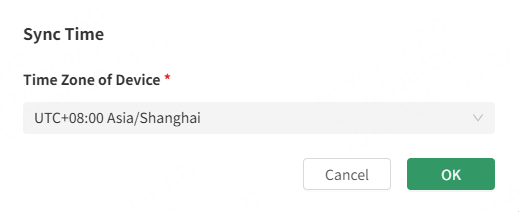
# Sync Time
Click Sync Time, select a time zone from the window that appears, and click OK.
# Device Diagnostics
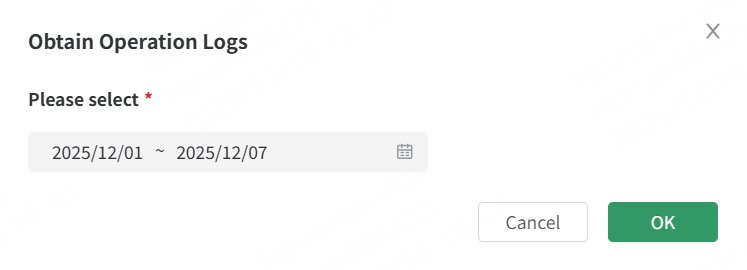
# Obtain Operation Logs
Click Obtain Operation Logs, then choose a start date and end date (with a maximum of 30 days of logs available) in the window that appears. Finally, click OK.
# Save to Hardware
In the window that appears, click OK to save all parameters related to the sending cards and receiving cards to the hardware.
# Peripherals Monitoring Details
# Camera Details
On the left of the Monitoring tab page, choose Peripherals > Camera to configure the camera to capture live snapshots, enabling real-time monitoring of the screen.
- Choose Peripherals > Camera.
- On the right of the page that appears, enable the camera.
- On the right of the target camera, click How to Configure a Camera? Then follow the instructions to configure the camera.
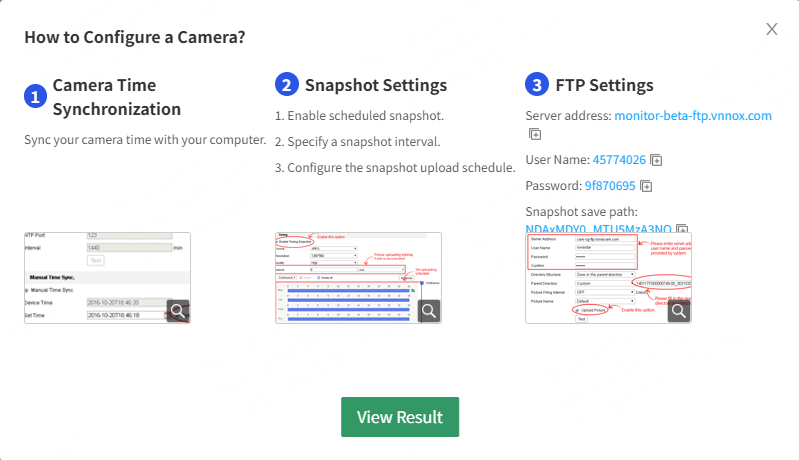
- After the camera parameter configuration is done, click View Result to view the configuration result.
# Other Peripherals Details
When other peripherals are connected, you can also view the connection status and related information of each peripheral.
- Choose Peripherals > Others.
- View the current connection status and related information of the peripherals.
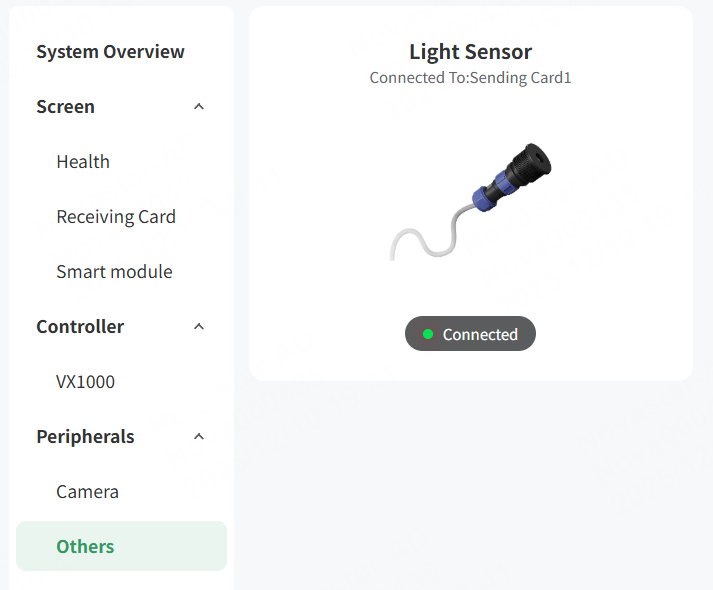
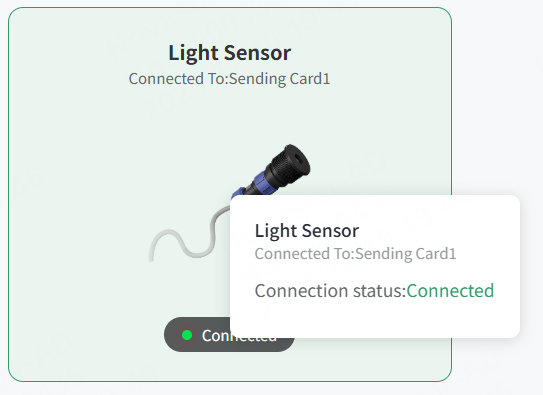
Hovering the mouse over a peripheral can view the detailed information.
# Alarm History
The Alarm History tab page displays all the alarm information, including but not limited to temperature anomalies, connection issues, and hardware failures. Each alarm record meticulously details the time of occurrence, cause, location, and level, assisting users in quickly identifying issues and taking appropriate measures.
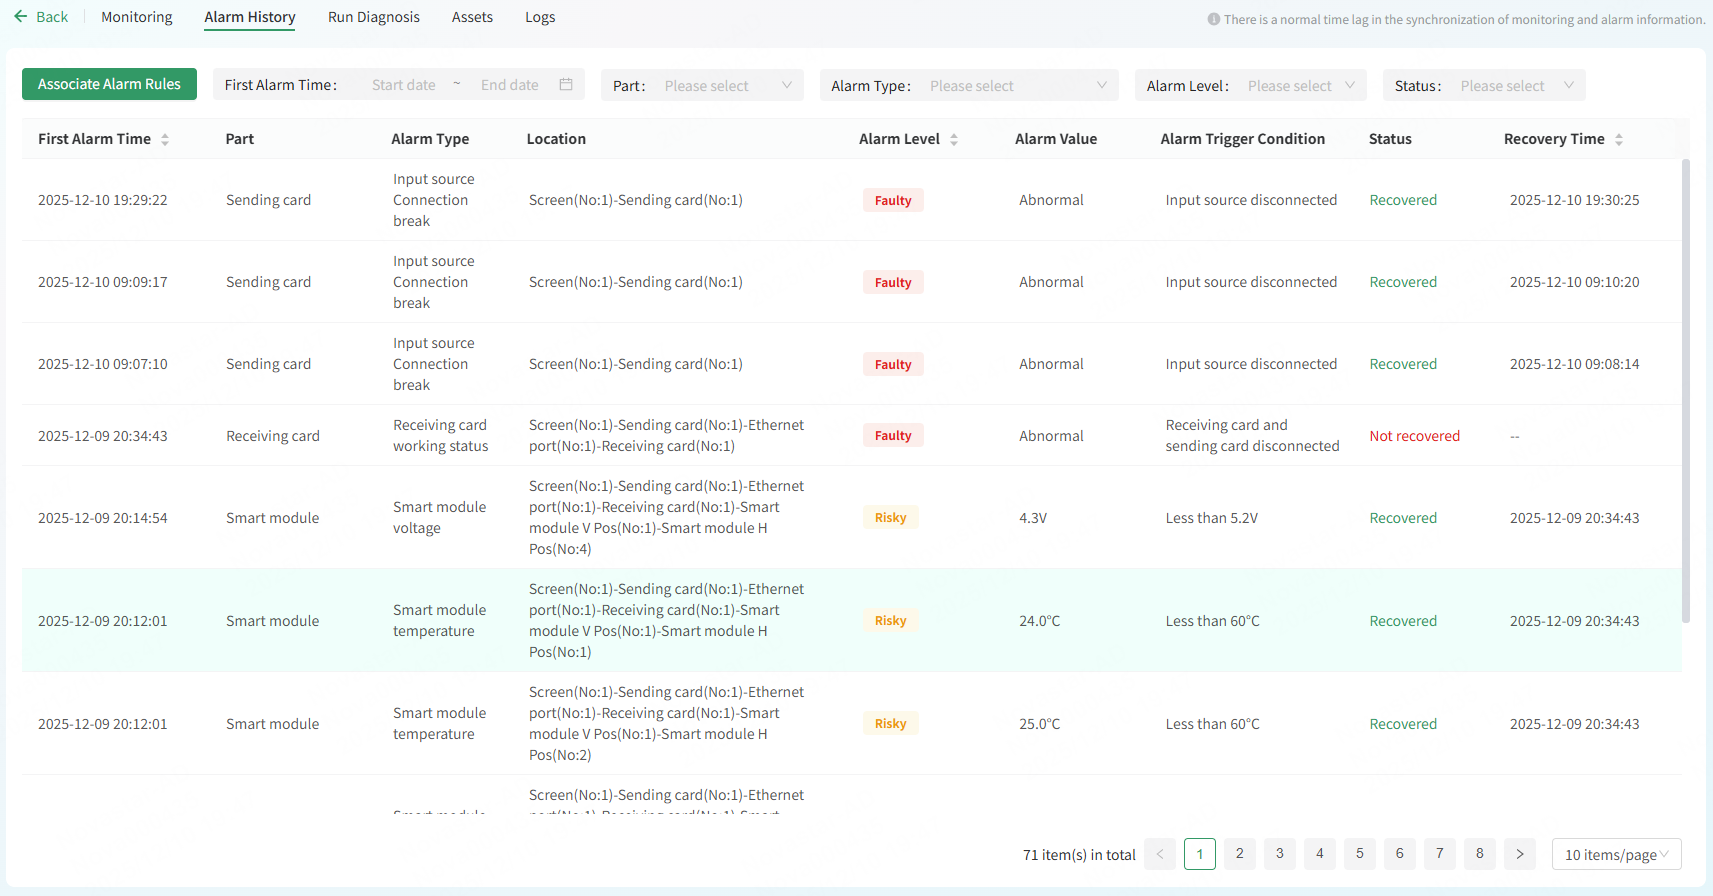
# View Basic Alarm Information
- Choose the Alarm History tab to view the basic information of alarms.
- Filter the alarms by time range, part, alarm type, alarm level, and status.
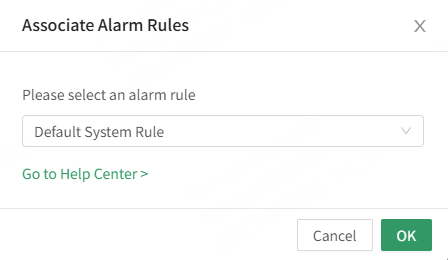
# Associate Alarm Rule
- Choose the Alarm History tab.
- Click Associate Alarm Rule.
- Select an alarm rule and click OK.
# Diagnosis
When common problems such as black screens, screen flickering, or network configuration issues arise on-site, you can use VNNOX Care for remote diagnosis. This quickly identifies the issues, reduces communication time, and enhances service efficiency. Meanwhile, if remote diagnosis cannot identify the on-site issues, you can ask the AI Chabot or contact the customer service.
Prerequisites:
- The screen for diagnosis has been bound to VNNOX Care.
- Diagnosis is available for devices including the TB series, TU series, V series, H series, etc.
- Choose the Run Diagnosis tab.
- Click Run Diagnosis to conduct a screen diagnosis.
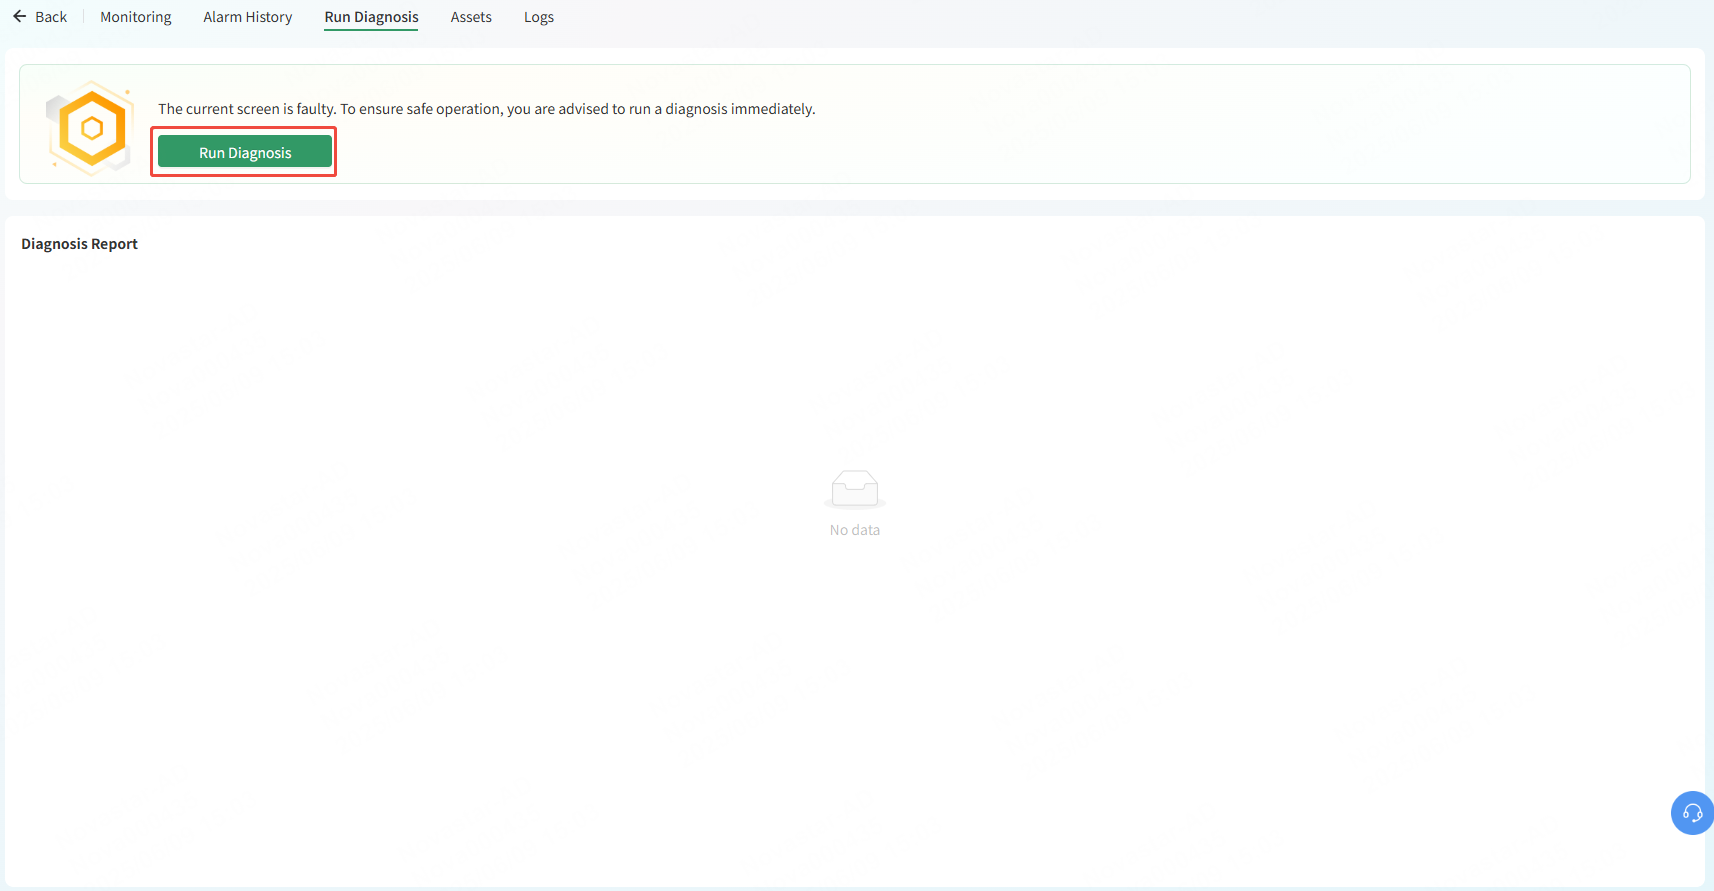
- After the diagnosis is complete, click View Report to view the diagnosis report.
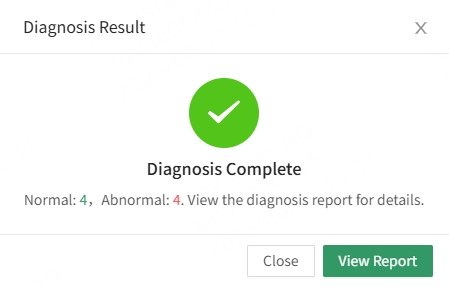
- In the Diagnosis Report area, click View, Download, or Delete next to a report to view, download, or delete the report.

# Assets
Users can manage the assets of the screen on the Assets tab page.
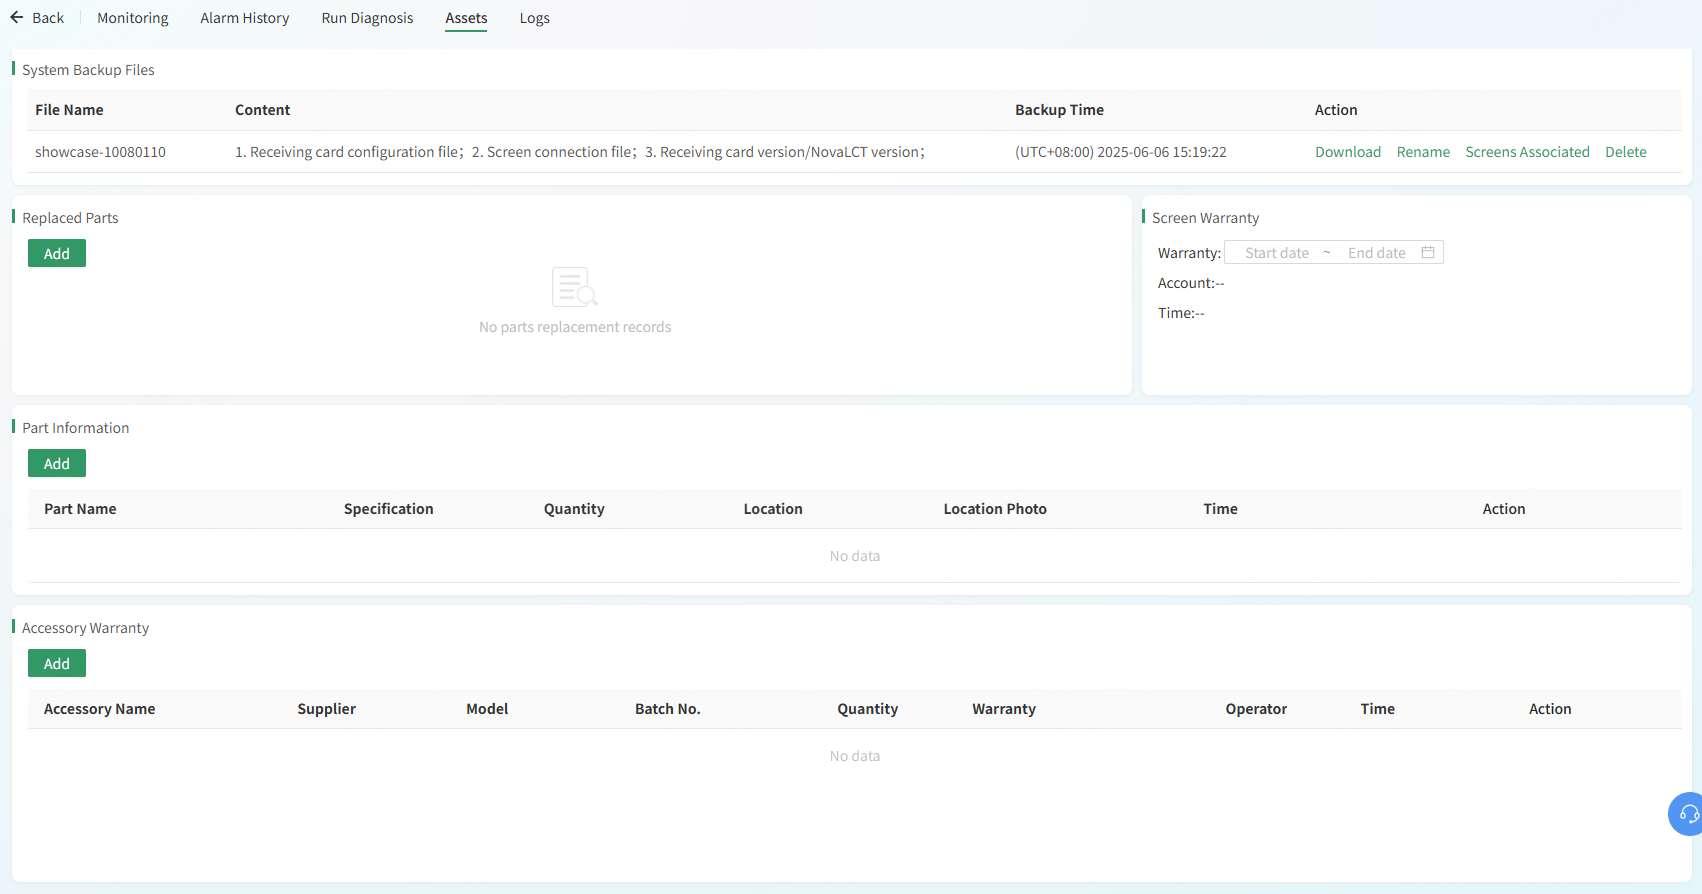
# Obtain Backup Files
Back up screen configuration files to the cloud during installation. If a hardware device is replaced or a configuration file is lost, you can download the backup files in the system backup files section to recover the screen as soon as possible. You can also download and rename the files, associate the files with screens, and delete the files. 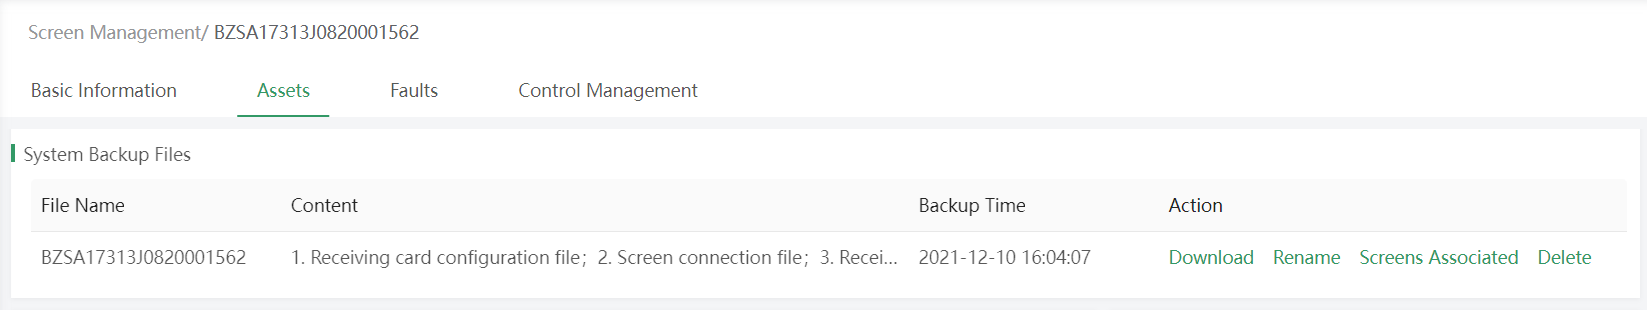
Note: The backup files can be obtained only after the screens are bound to VNNOX Care by backing up the configuration files to cloud in NovaLCT. For details, see Bind Screens to VNNOX Care by Using NovaLCT in VNNOX Care for Web Quick Start Guide.
# Manage Parts Replacement
In the Replaced Parts and Part Information sections, you can record spare parts and replaced parts, and specify the warranty period of the screen during the installation and maintenance, making it convenient for you to prepare the parts required for the next maintenance. 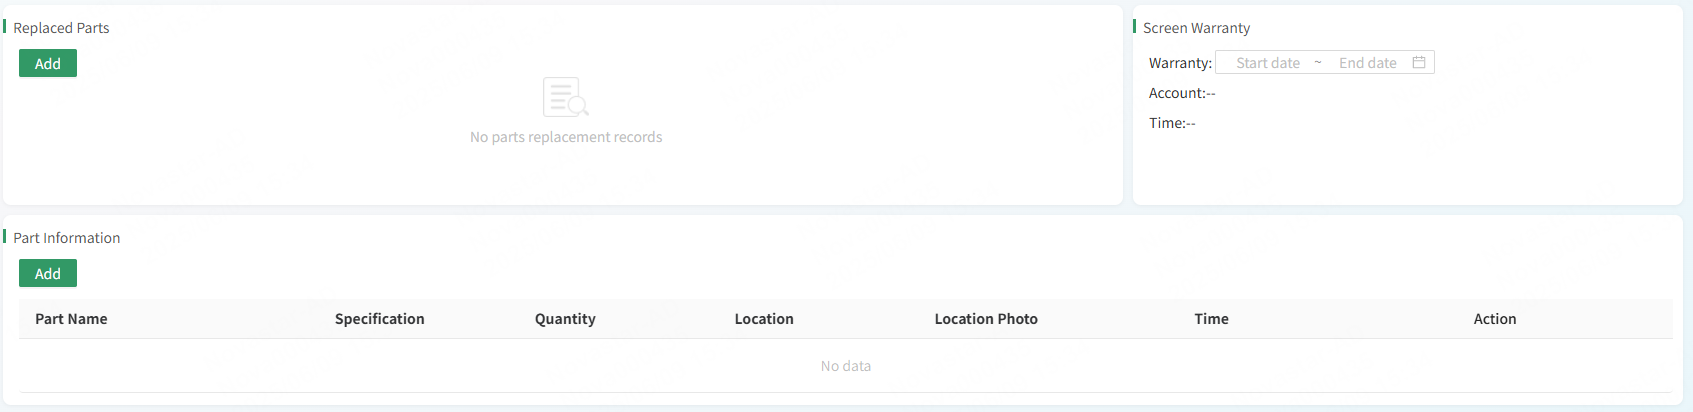
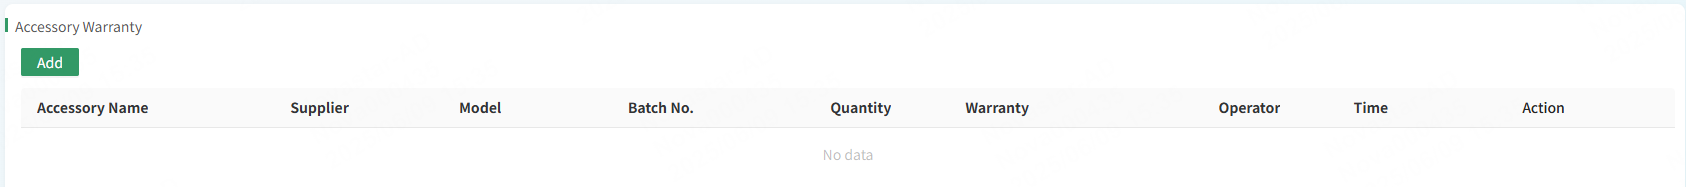
# Manage Warranty Information
In the Accessory Warranty section, you can record the accessories and warranty information, making it convenient for you to confirm whether an item requiring maintenance is within the warranty period.
# Logs
Logs include alarm notification logs, LED detection logs, system control logs, online/offline logs, and brightness adjustment logs.
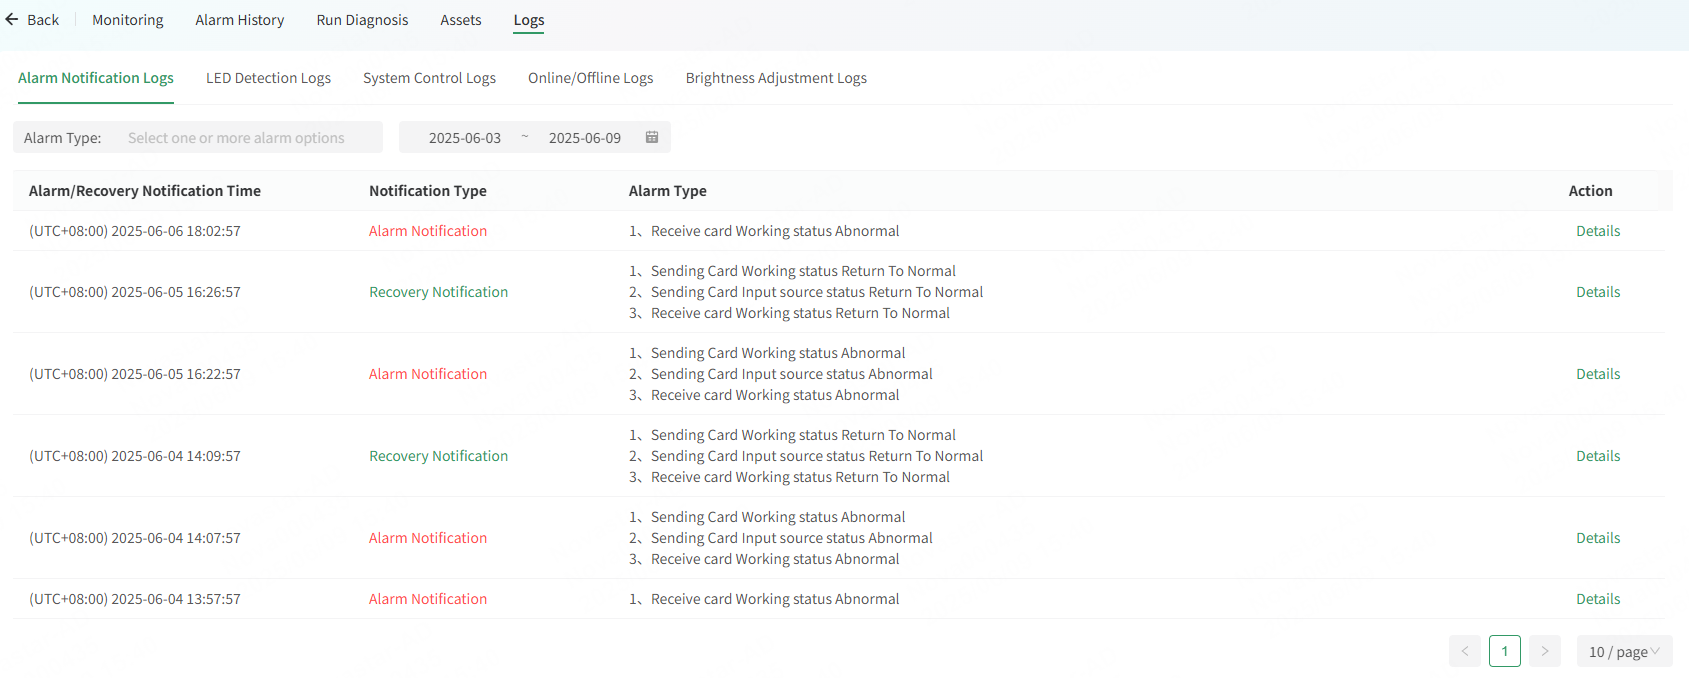
# Alarm Notifications Logs
Displays various alarms during operation, including alarm/recovery notification time, notification type, and alarm type. You can search or filter by alarm type and time range to find the required logs. Click Details to view specific information.
# LED Detection Logs
Displays the LED detection logs, including information such as the number of faulty LEDS and modules to repair. You can click Details to view specific log information.
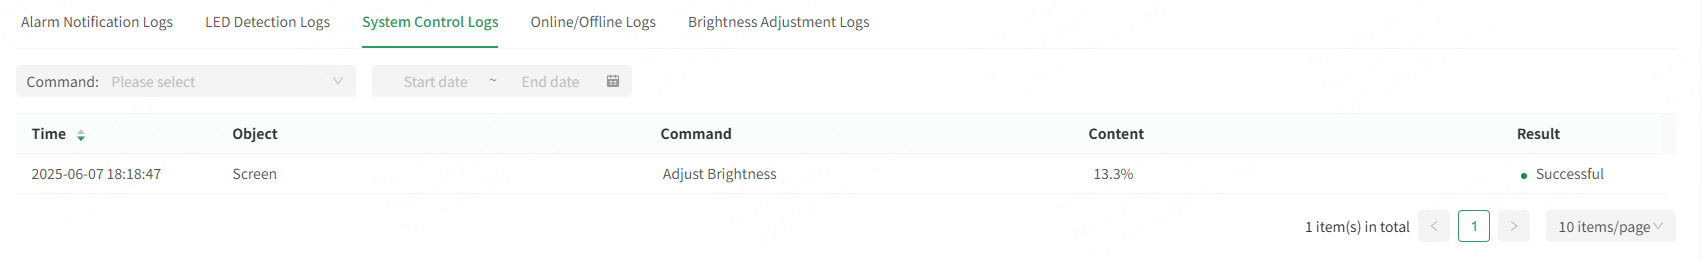
# System Control Logs
Displays all types of control operations performed on the screen, such as brightness adjustment and controller restart. Logs can be searched or filtered by command and time range to find the required information.
# Online/Offline Logs
Displays the connection status of the screen, allowing users to know when the device is online or offline and when the connection status is changed, ensuring the stable operation of the screen. 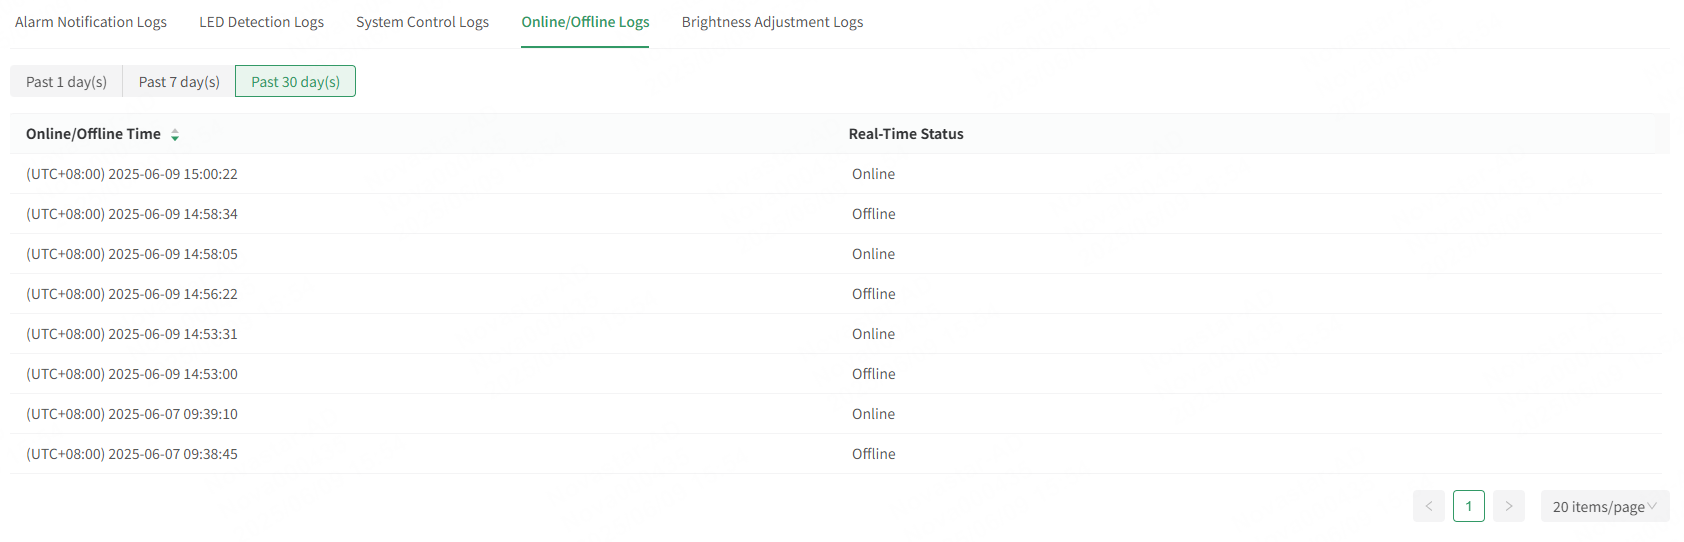
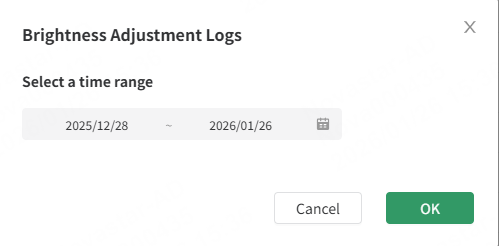
# Brightness Adjustment Logs
Displays the screen brightness adjustment time and results, allowing users to know the actual brightness of the screen.
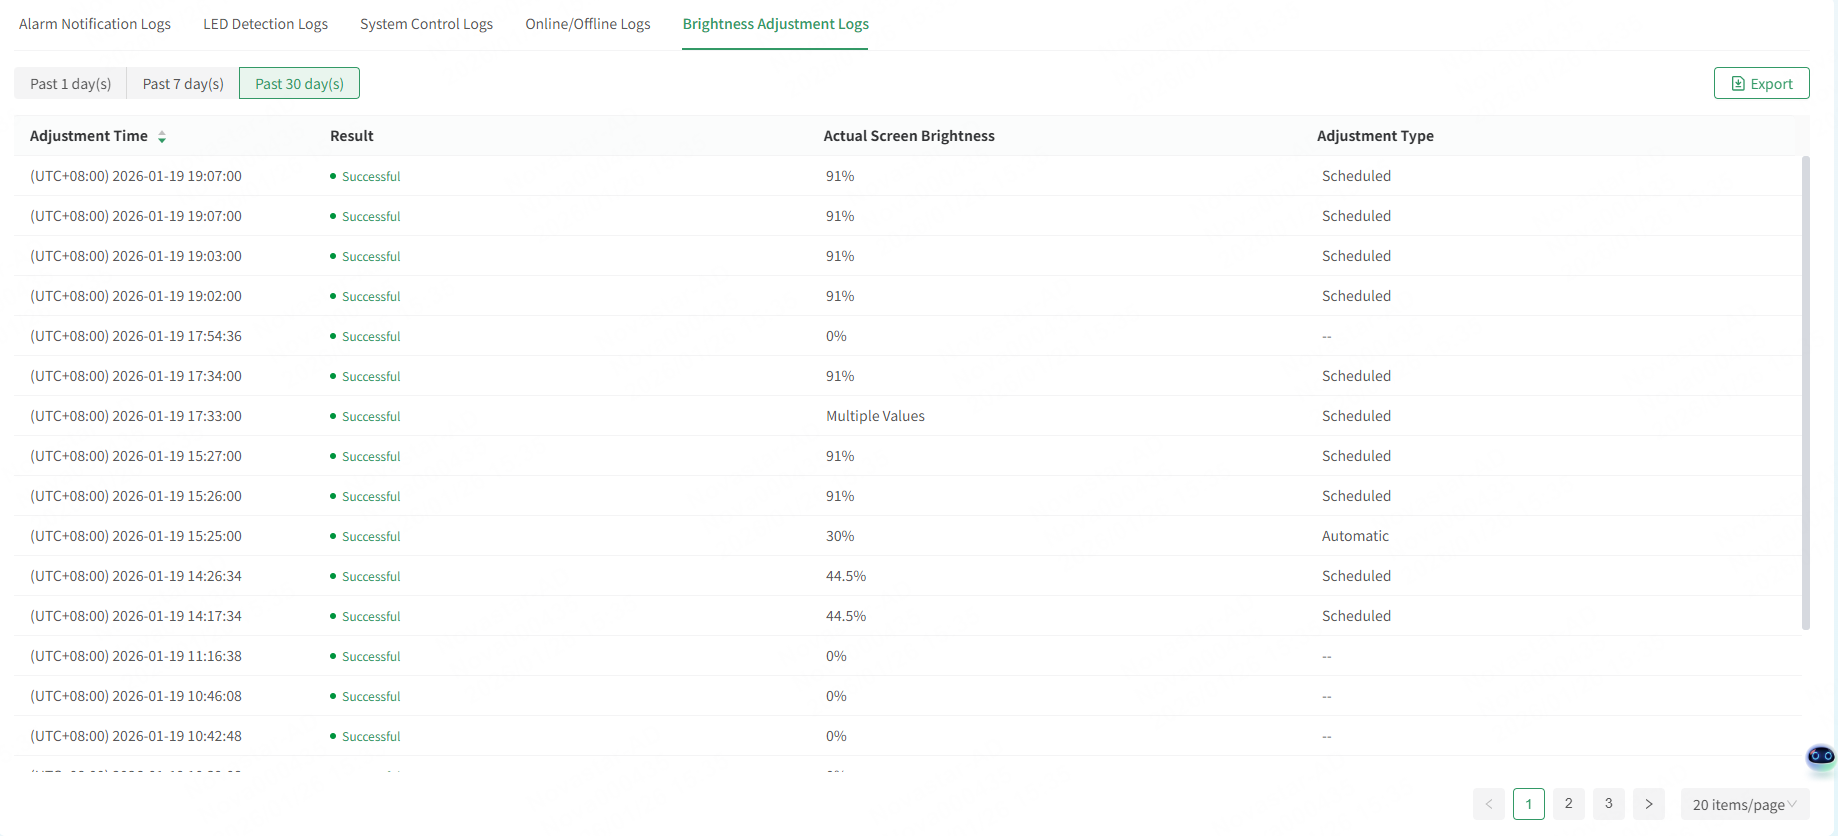
Click Export at the upper right corner of the page. After specifying a time range in the window that appears, click OK. You can view the exported brightness adjustment log from your computer.